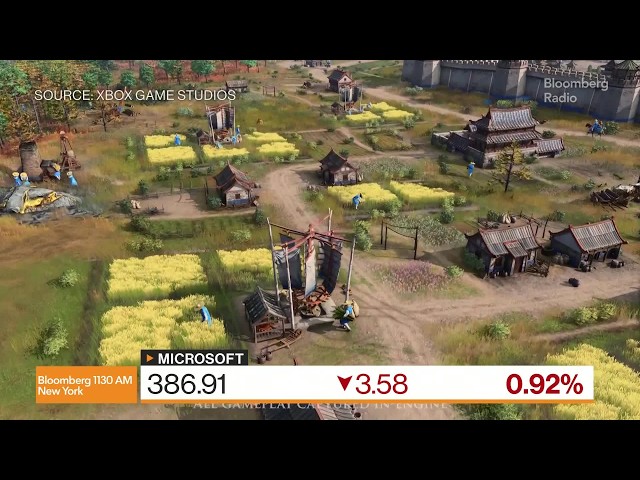
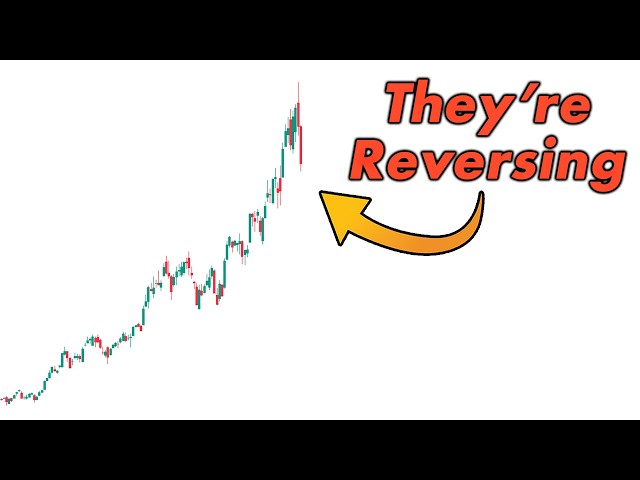
The S&P 500 and Nasdaq keep pressing to fresh all-time highs, but underneath the surface a very different story has been quietly unfolding for weeks — and almost nobody is talking about it. In today's stock market report, we walk through why so many breadth and signal charts are already pushing into oversold territory before the indices have even pulled back five percent, what that tells you about the health of this rally, and how to position for the rotations that are already happening beneath the highs. We break down the parabolic SAR turn on the Nasdaq Summation Index, the Nasdaq Composite Bullish Percent Index easing off its bearish divergence, the BP SPX RSI moving into oversold while the index floats near all-time highs, the percent of stocks above the 20, 50, and 200 day moving averages actually rising on a down tape, and what that rotation signal historically means for the next leg. We cover the equal weight consumer discretionary ETF RSPD collapsing in near perfect inverse lockstep with the 10-year yield while cap weighted XLY masks the damage thanks to Amazon and Tesla, the energy sector going into overbought territory and what that has historically meant for the S&P 500, consumer staples ripping to new highs led by Walmart, Costco, and McDonald's, and semiconductors breaking a steep trend line and what to expect when that happens. We update the daily, weekly, and monthly implied moves on SPY and SPX, walk through where the Fantastic 8 names sit relative to their weekly implied moves including NVDA, MSFT, GOOGL, AAPL, TSLA, AVGO, META, and AMZN, preview Nvidia and Home Depot earnings and the expected moves the market is pricing in, and highlight two standard deviation daily moves in names like Generac (GNRC), Mobileye (MBLY), AEHR Test Systems, Seagate (STX), and Tower Semiconductor (TSEM) that could become consolidation and continuation setups. We also touch on the Trump tweet on Iran that rescued the tape intraday, why the market felt heavy regardless, the upper weekly implied move at 6139, the lower weekly at 7256, and the volume weighted average price level that would represent a healthy 5 to 6 percent pullback in the S&P 500. If you trade options, swing trade breakouts, follow market breadth, intermarket analysis, implied moves, or care about rotations, earnings setups, and where rates and energy are actually pushing this market, this is the kind of stock market analysis you don't want to miss.
🟢 TRADE IDEAS & DISCORD:
https://www.patreon.com/figuringoutmoney
__________________________________________________________________________________________
🔔 Subscribe now and never miss an update:
https://www.youtube.com/c/figuringoutmoney?sub_confirmation=1
📧 For business inquiries or collaboration opportunities, please contact us at
FiguringOutMoney@gmail.com
📈 Follow us on social media for more insights and updates:
🟢 Instagram:
https://www.instagram.com/figuringoutmoney
🟢 Twitter:
https://twitter.com/marketmike
______________________________________________________________________________________________
DISCLAIMER: I am not a professional investment advisor, nor do I claim to be. All my videos are for entertainment and educational purposes only. This is not trading advice. I am wrong all the time. Everything you watch on my channel is my opinion. Links included in this description might be affiliate links. If you purchase a product or service with the links that I provide I may receive a small commission. There is no additional charge to you! Thank you for supporting my channel
#Stockmarket
#StockMarketAnalysis #DayTrading


Comments (0)