Accurate predictions of disordered protein ensembles with STARLING
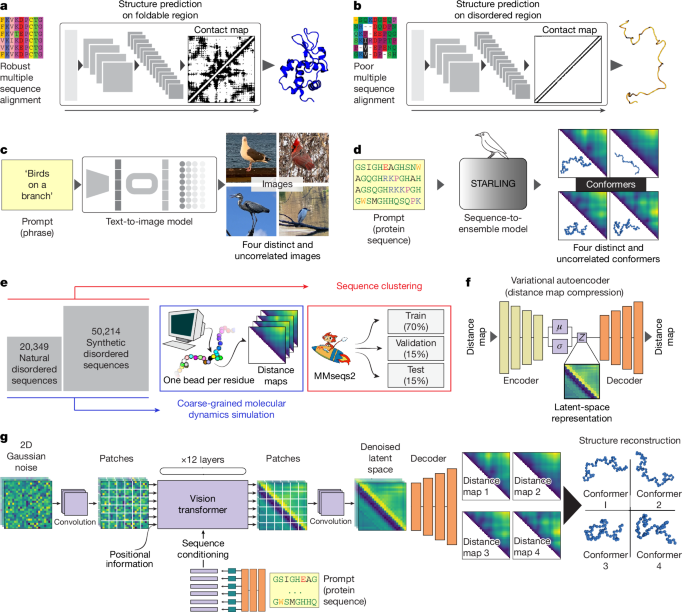
IDRs are structurally heterogeneous protein regions that are estimated to constitute approximately 30% of eukaryotic proteomes1. Despite lacking a fixed structure, IDRs have key roles in essential cellular processes such as transcription, translation and cell signalling1. Owing to their broad structural heterogeneity, IDRs must be described by a conformational ensemble: a large collection of structurally distinct and interchanging conformations1. However, although IDRs cannot be represented as a single 3D structure, they do still possess sequence-encoded conformational biases, and ensembles can have essential roles in IDR function and may be perturbed in disease2,3,4. Just as structural biology has been instrumental in understanding the molecular basis for folded domain function, there is a growing appreciation that the characterization of IDR ensembles may be important for understanding IDR function5,6.Various experimental techniques have been applied to interrogate sequence–ensemble relationships7,8,9. Although these report on specific aspects of IDR ensembles, they fall short of providing a holistic description of the distribution of conformers (that is, the 3D coordinates of all residues in the protein across many different conformations, referred to here as a ‘full structural ensemble’). To achieve this, the integration of computational modelling with experimental data has proven an effective route10,11,12,13.Conceptually, computational models and experiments can be combined in two different ways. One approach involves using physics-based models and reweighting or biasing towards experimental observables14,15. Another involves using experimental data to parameterize transferable force fields, which, in principle, do not require additional reweighting16. Although both approaches have been effective in providing insight into IDR behaviour, they require deep technical expertise to ensure reliable conclusions are drawn, and can also be computationally expensive.Although recent advances in coarse-grained simulations17,18,19 offer a faster alternative (and both modalities described above can be applied here), even coarse-grained simulations can still take hours to obtain sufficient sampling and still require a relatively high level of technical expertise to set up, run and analyse. Recent deep learning predictors trained on coarse-grained simulations have enabled proteome-scale predictions for ensemble average values, but are limited to specific observables for which a predictor was trained (for example, radius of gyration (Rg) or radius of end-to-end distances (Re))20,21.Deep learning approaches have transformed protein structure prediction, significantly reducing the barrier to large-scale exploration of sequence–structure relationships22 (Fig. 1a). However, these methods are poorly suited to investigate IDRs23 owing to a reduction in alignment-based conservation in disordered proteins, a paucity of appropriate experimental training data and optimization for an inappropriate objective (predicting a single best structure from sequence, whereas IDRs should be described by a large, conformationally heterogeneous ensemble; Fig. 1b). In short, although we now possess easy-to-use tools for accurately predicting the 3D structure of folded proteins, equivalent tools for rapid and accurate IDR ensemble prediction are lacking.Fig. 1: STARLING approach and model architecture.a, Deep learning has revolutionized protein structure prediction, with major advances being facilitated by large-scale evolutionary information. b, Structure prediction methods for folded domains are poorly suited for predicting the behaviour of IDRs. These limitations stem from the absence of a native-state structure and because evolutionary information is often poorly captured in multiple sequence alignments (MSAs) of IDRs. c, Generative text-to-image models enable the creation of many unique and independent images consistent with a single input prompt. d, IDR ensemble generation shares many similarities with text-to-image generation; we required many distinct, uncorrelated conformers, all of which are consistent with an input prompt (an amino acid sequence). e, STARLING was trained on approximately 50,000 amino acid sequences at 150 mM ionic strength and approximately 14,000 sequences at 20 mM and 300 mM ionic strength. The sequences performed at 20 mM and 300 mM ionic strength are a subset of those simulated at 150 mM ionic strength. For each sequence, hundreds of distinct conformers were generated using coarse-grained molecular dynamics simulations, and each conformer was converted into a distance map (an image). Sequences were split into training, testing and validation sets. The MARV cartoon was reproduced from ref. 61, Martin Steinegger. f, STARLING makes use of a VAE to compress distance maps to a latent space, allowing a denoising diffusion model to work in this latent space (‘latent diffusion’). g, The overall architecture of the STARLING model combines a latent-space probabilistic denoising diffusion model with a vision transformer architecture using both convolutions and transformer blocks. Latent-space maps were decoded to real space via the VAE decoder. Finally, distance maps can be reconstructed into 3D coordinates via a parallelized multidimensional scaling approach.Here we addressed these challenges by developing a fast and accurate approach for predicting full coarse-grained disordered protein structural ensembles directly from the amino acid sequence. Our approach leveraged advances in generative modelling, a deep learning technique capable of creating new and original data. However, developing a generative model poses a key challenge: the need for large training datasets. To address this, we performed large-scale coarse-grained simulations to generate full structural ensembles across tens of thousands of natural and synthetic IDRs. The resulting method — STARLING — allowed us to generate structural ensembles directly from sequence in seconds. A major goal in developing STARLING was to avoid hardware barriers. Although STARLING is fast (approximately 35 conformers per second) on GPUs, it can still generate ensembles in minutes on Intel/AMD CPUs and seconds on Apple CPUs.STARLING-generated ensembles show good agreement with experimental data, enabling de novo exploration of uncharacterized IDRs or aiding in the biophysical interpretation of experimental data. Moreover, here we show proof of concept that STARLING can be used to (1) investigate sequence–ensemble relationships for disordered proteins; (2) explore bound-state conformational ensembles for binary disordered protein complexes; and (3) provide conformation-aware latent representations for IDR characterization, search and design. Together, we propose that the ease of use and speed of STARLING make it a powerful tool for democratizing large-scale exploration of sequence–ensemble relationships in IDRs.Generative artificial intelligence (AI) has been transformative for text-to-image generation24,25. In text-to-image generative AI, an image is generated by passing a prompt (a short phrase describing the desired image) to a pre-trained deep learning model. The model then generates an image consistent with the prompt, a process referred to as inference. Deep learning models capable of inference must first be trained. For models used in modern text-to-image generative AI, training is not simply memorization but also learning the relationship between prompts and the features in the associated images. As a result, once a model is trained, if the same prompt is reused many times, it will generate many independent images entirely distinct from any of the individual instances observed in training. Of note, despite being different from one another, each generated image should be consistent with the prompt (Fig. 1c).The mapping of a single text prompt to a collection of different images — each of which is consistent with the input prompt — is precisely the problem that we wished to solve for IDR ensemble generation. In IDR ensemble generation, we wanted to take a text prompt (amino acid sequence) and generate a collection of many distinct and uncorrelated IDR conformations consistent with that prompt (Fig. 1d). Moreover, we wanted this generation process to be fast (seconds) and possible on commodity hardware (laptops and desktops). To achieve this goal, we combined a variational autoencoder (VAE) with a discrete-time denoising-diffusion probabilistic model (DDPM) to create a latent diffusion model25. The resulting method (STARLING) enabled the accurate and rapid prediction of coarse-grained conformational ensembles of IDRs.STARLING was trained on approximately 50,000 unique rationally designed and naturally occurring IDR sequences (10–384 residues) simulated at 150 mM ionic strength (Supplementary Table 1). Among these, approximately 14,000 were additionally simulated at 20 mM and 300 mM ionic strength (Fig. 1e, Extended Data Fig. 1a,b and Supplementary Table 2). Rationally designed sequences were designed using GOOSE26 (see Methods; Extended Data Fig. 1c–f). Although naturally occurring IDRs provide training data focused on the most relevant manifold of sequences, the inclusion of a large number of rationally designed sequences allowed us to construct training data that systematically titrates across sequence space, yielding a well-rounded training set that captures the extremes of sequence composition and patterning.A necessary decision in deep learning models is defining the limits of your training data. We focused on sequences up to 384 amino acids in length for several reasons. First, almost 95% of naturally occurring IDRs across common model organisms are shorter than 384 amino acids (Extended Data Fig. 1h,i). Second, this length enables well-sampled coarse-grained simulations to be completed on a reasonable timescale. Third, the underlying architecture of the model requires a fixed upper limit (see Methods). Finally, experimental characterization of disordered protein sequences longer than approximately 350 residues is lacking, making it difficult to assess the validity of model predictions relative to experiments for very long disordered proteins.Molecular dynamics simulations were performed using the Mpipi-GG force field. Mpipi-GG20 — a variant of the original Mpipi force field17 — is a one-bead-per-residue coarse-grained model developed for disordered regions. Once run, conformations from simulations of a sequence of length n were converted into distance maps, n × n matrices, where each element describes the distance between the i-th and j-th residue for a specific conformation. This converts each IDR conformation into an ‘image’, allowing us to directly leverage innovations developed for conditional image generation. Overall, our training dataset comprised nearly 12 million distance maps.Two core limitations of DDPM models are their substantial memory requirements and the slow generative process during inference. These limitations arise from performing the reverse denoising process in a complex, high-dimensional space (for example, images of size 384 × 384 pixels). To mitigate this, we developed a VAE to compress each distance map into a lower-resolution latent space (24 × 24 pixels)27 (Fig. 1f). The denoising diffusion process can then occur in this latent space (latent diffusion), significantly reducing memory requirements and inference time. Given this, STARLING was trained in two independent stages.We first trained a highly accurate VAE that enables the compression of full-resolution distance maps into latent space (Extended Data Fig. 2a). Our VAE uses a ResNet18 architecture and learns parameters for an encoder (full resolution to latent space) and a decoder (latent space to full resolution)28. We assessed the accuracy of VAE by encoding and decoding distance maps derived from sequences substantially different from those used in the training and validation sets. We evaluated our model on a held-out test set comprising approximately 16,000 simulations, totalling nearly 2.5 million distance maps. The model achieved a root-mean-square reconstruction error (RMSE) of 1.16 Å (Extended Data Fig. 2b). Furthermore, our model accurately reconstructed bond lengths, with a root-mean-square reconstruction error of 0.18 Å (Extended Data Fig. 2c), crucial for modelling protein conformations.In the second stage of training, we developed a DDPM (Fig. 1d and Extended Data Fig. 2d–f). In brief, this model was trained to learn parameters that map random noise to individual latent-space conformer distance maps, conditioned on the associated amino acid sequence and ionic strength (see Methods). The training data came from nearly 12 million distance maps across almost 78,000 simulations. Each map was first compressed into a latent space, and then the fixed forward diffusion process was used to add noise to each latent-space distance map. The underlying vision transformer model was then trained to learn parameters that reversed this forward diffusion process, conditioned on the input amino acid sequence and ionic strength (Fig. 1g). Ultimately, ensemble generation is enabled by running many inference rounds in parallel, creating many independent distance maps.Although training requires the VAE encoder to generate latent-space distance maps, only the VAE decoder is needed for inference once the model is trained. Ultimately, the fully trained model (STARLING) combines two different models (the VAE decoder and the DDPM) that work together to enable rapid ensemble prediction. Using default settings, STARLING can generate 400 independent IDR conformations in approximately 12 s on a GPU (Nvidia A4000), 20 s on a Macbook Pro M3 CPU and approximately 6 min on an Intel CPU (Intel(R) Xeon(R) Silver 4210 R CPU @ 2.40 GHz; Extended Data Fig. 3a,b). The prediction runtime and memory are roughly independent of sequence length; 400 conformations for a 50-amino-acid IDR took approximately 10 s, whereas 400 conformations for a 350-residue IDR took approximately 14 s, and prediction times were not hampered by low-memory GPUs (Extended Data Fig. 3c–e).We first checked that the STARLING-derived ensemble-averaged global dimensions agree with those obtained from the Mpipi-GG simulation of unseen sequences. In all cases, STARLING ensembles comprised 800 conformers. Using a held-out test set of approximately 10,000 sequences, we performed Mpipi-GG simulations at 150 mM ionic strength and calculated Rg and Re. Our STARLING-derived Rg (RMSE = 0.85 Å, R2 = 0.996) and Re (RMSE = 3.48 Å, R2 = 0.989) values are in excellent agreement with the simulations (Fig. 2a,b).Fig. 2: Evaluating STARLING on held-out simulation data.a, Comparison of STARLING-derived average Rg values with those from Mpipi-GG (simulations) from a set of approximately 10,000 unseen sequences. b, Comparison of STARLING-derived average Re values with those from Mpipi-GG (simulations) from approximately 10,000 unseen sequences. c, Comparison of STARLING-derived Rg values with those from Mpipi-GG (simulations) from a set of approximately 3,000 unseen sequences at an ionic strength of 20 mM. d, Comparison of STARLING-derived Rg values with those from Mpipi-GG (simulations) from a set of approximately 3,000 unseen sequences at an ionic strength of 300 mM. e, STARLING ensembles enable the calculation of distributions of observables. Distribution similarity can be quantified by the Hellinger distance (H), where H = 0 is perfect overlap and H = 1 is no overlap. f, Overlap of Rg distributions obtained from STARLING (blue bars) and Mpipi-GG (orange line), with the experimental value shown for completeness. Overlap between the STARLING and Mpipi-GG distributions was quantified by the H value and the KS statistic (D) to assess the difference between the distributions and the effect size of the difference. A KS statistic of 0.02 means that the CDFs of the two distributions differ by at most 2%. Vertical dashed lines indicate the average STARLING-derived value. g, 3D configurations (left) can be represented as distance maps (right), where each pixel defines the distance between a pair of residues (rij). h, Ensembles of conformations (left) can be represented as ensembles of distance maps (right). i, Intra-residue distance distributions in STARLING ensembles can be compared with equivalent distributions from Mpipi-GG simulations. j, All possible intra-residue distances can be compared between STARLING and Mpipi-GG simulations using H to quantify overlap in distributions (top). Histograms of intra-residue H values are also shown (bottom). k, Pairwise inter-residue distance comparison across different exemplar ensembles reveals excellent overlap.As STARLING was also trained on Mpipi-GG simulations at both 20 mM and 300 mM ionic strength, we verified that STARLING-derived ensemble-averaged global dimensions match the simulations. Using a held-out test set of approximately 3,000 unseen sequences, we performed Mpipi-GG simulations at ionic strengths of 20 mM and 300 mM. Our STARLING-derived Rg (Fig. 2c,d; RMSE = 0.98 Å and 1.12 Å, R2 = 0.995 and 0.992 for 20 mM and 300 mM, respectively) and Re (Extended Data Fig. 4a,b; RMSE = 4.17 Å and 4.53 Å, R2 = 0.986 and 0.978 for 20 mM and 300 mM, respectively) are again in the excellent agreement with simulations.Model accuracy depends on the balance between ensemble size and denoising steps. By comparing STARLING results to long-timescale Mpipi-GG simulations, we found that error in the Rg stabilizes beyond 30 denoizing steps and 400 conformations (Extended Data Fig. 4c–i). We adopted these as default parameters, although larger ensembles may be required for other order parameters.As Re and Rg are highly correlated with sequence length, we next assessed the accuracy of our model on a set of length-matched sequences29. This approach allowed us to determine whether the model had effectively captured the influence of sequence chemistry on the global dimensions of IDRs, or whether it had simply learned to relate sequence length to these dimensions. Using all 100-residue, 200-residue and 300-residue sequences with distinct sequence chemistries from the held-out test set, we found excellent agreement across a range of Rg (Extended Data Fig. 4j; RMSE = 0.78 Å, 1.18 Å and 1.20 Å, R2 = 0.984, 0.990 and 0.995 for 100-residue, 200-residue and 300-residue lengths, respectively) and Re (Extended Data Fig. 4k; RMSE = 3.38 Å, 4.22 Å and 5.65 Å, R2 = 0.965, 0.984 and 0.986 for 100-residue, 200-residue, 300-residue lengths, respectively). These results gave us confidence that STARLING had learned bona fide sequence-to-ensemble rules instead of simply learning polymer scaling theory.In addition to ensemble-averaged observables, full structural ensembles enabled us to calculate distributions of any observable of interest (Fig. 2e). We set out to assess how well STARLING-derived global dimension distributions match distributions from simulations. We used the Hellinger distance (H) as a similarity measure to compare distributions. H ranges from 0 to 1, where zero indicates that the distributions are identical, and one signifies that they are entirely disjoint (Fig. 2e). The STARLING-derived Rg distributions show excellent agreement with distributions from simulations (Fig. 2f). This overlap was quantified by a low H, confirming the high degree of similarity between the two distributions.Finally, to quantify ensemble fidelity, we assessed all inter-residue distance distributions between ensembles generated using STARLING or Mpipi-GG simulations. Each 3D conformation can be represented as a single distance map (Fig. 2g), and the ensemble of conformations can be represented as an ensemble of distance maps (Fig. 2h). Therefore, every inter-residue distance distribution from a pair of residues in a STARLING ensemble can be compared against the corresponding distribution from an Mpipi-GG (Fig. 2i). For a 100-residue IDR, this yields 4,900 unique distribution comparisons. We could quantify the overlap between the distributions using H and visualize each pair using a heat map (Fig. 2j, top). Furthermore, we could use histograms for those H to provide an overall assessment of the ensemble agreement (Fig. 2j, bottom). Overall, we found excellent agreement across all distance distributions investigated (Fig. 2k). In summary, all evidence supports that STARLING can directly predict conformational ensembles of disordered proteins from sequence.Having established that STARLING can recapitulate simulated ensembles, we next investigated agreement with experimental data (Fig. 3a). We used a previously curated set of 133 sequences for which high-quality small-angle X-ray scattering (SAXS) data have been assembled and computed average Rg values. We found excellent agreement between average Rg values from STARLING and SAXS-derived Rg, yielding values comparable with state-of-the-art coarse-grained simulations (RMSE = 4.53, R2 = 0.90; Fig. 3b, Extended Data Fig. 5a–h and Supplementary Tables 3 and 4).Fig. 3: Experimental validation of STARLING.a, STARLING enables rapid generation of ensembles from sequence. b, STARLING shows state-of-the-art accuracy in terms of predicting the average Rg from sequence. IDR sequences (n = 133) comparing SAXS-derived and STARLING-derived average Rg values (see also Extended Data Fig. 4c–f) are shown. c, STARLING accurately captures the effect of small numbers of mutations, here illustrating how altering the number of aromatic residues changes the global dimensions of a low-complexity domain (LCD) taken from the RNA-binding protein hnRNPA1. Y/F, tyrosine/phenylalanine. d, Full scattering curves can be back-calculated from STARLING ensembles using FOXS, illustrating how changes in conformational behaviour alter both global dimensions (small angles and low q values) and the shape of the ensemble (intermediate and high q values). e, Comparison of 12 different SAXS profiles with scattering profiles calculated from STARLING ensembles. The insets show STARLING Rg distributions, with average Rg values from scattering data displayed as a solid black line. See also Extended Data Figs. 4j,k and 5a–h. f, STARLING-derived Re distance distributions with experimental values are shown as black lines for 16 different length-matched disordered protein sequences with different sequence chemistries. See also Extended Data Fig. 5i–k. g, SAXS scattering curves for unlabelled proteins for a subset of those in panel f.To further validate STARLING, we predicted ensembles for 3,417 IDRs from DisProt30, successfully replicating established sequence-conformation trends (for example, aromatic residues drive compaction, whereas proline and glutamic acid promote expansion3,20,31,32; Extended Data Fig. 5i–k and Supplementary Table 5). STARLING-generated ensembles are also sensitivity to minor sequence changes; when tested on four hnRNPA1 low complexity domain (LCD) variants, the predicted dimensions of the model quantitatively matched experimental SAXS data regarding aromatic content3 (Fig. 3c).To go beyond simple Rg comparisons (Fig. 3b,c), we leveraged STARLING-generated ensembles to back-calculate synthetic SAXS curves using FOXS33. This allows for a direct comparison between our model and raw experimental SAXS data (down to 5–10 Å resolution). We demonstrated that STARLING accurately captures the subtle conformational shifts in A1-LCD variants, as reflected in their specific scattering profiles3. Next, we selected 12 unrelated IDRs for which high-quality scattering data were available and compared scattering profiles derived from STARLING ensembles with experimental data, finding excellent agreement across a wide range of sequence chemistries and sequence lengths (Fig. 3e and Supplementary Table 3). We further reanalysed 40 additional sets of scattering data, finding that the majority are in excellent agreement with STARLING-derived scattering profiles (Extended Data Fig. 6a and Supplementary Figs. 1 and 2). Together, our data suggest that our STARLING ensembles faithfully reproduce experimentally measured IDR ensemble behaviour across a range of length scales and sequence chemistries.Finally, we sought to compare against an alternative experimental modality in single-molecule Förster resonance energy transfer (smFRET). Recent work has illustrated how a series of 16 length-matched sequences shows a range of end-to-end distances depending on the underlying sequence chemistry34. We compared predicted end-to-end distances (and, where available, SAXS-derived scattering data) for those 16 sequences, again finding good agreement between STARLING ensembles and experimental data (Fig. 3f, Extended Data Fig. 6b,c and Supplementary Table 3). Of note, our average error here across the 16 sequences (RMSE of 6.7 Å) is comparable with the differences obtained between different experimental groups in a recent smFRET benchmarking study35. Overall, our work suggests that STARLING can generate full coarse-grain ensembles of IDRs that accurately capture experimental data.Having established that STARLING can reproduce extant experimental data, we applied it to investigate a set of distinct IDRs across various contexts. These vignettes illustrate the types of rapid exploration and hypothesis generation that STARLING enables.The master transcriptional regulator Myc (439 residues) underlies cell growth, metabolism and proliferation, and is frequently dysregulated in many cancers36. Myc consists of a large N-terminal IDR (Myc1–361), a C-terminal HLH DNA-binding domain (Myc368–406) and a leucine zipper (Myc413–439). The large size of its IDR, coupled with its chemical composition, has challenged biophysical characterization (Fig. 4a). Using STARLING, we generated conformational ensembles of Myc1–361 to investigate sequence-encoded conformational biases in the ensemble (Fig. 4b and Extended Data Fig. 6d). In particular, we wondered whether conformational behaviour would offer insight into regions within Myc known to bind to other partners (so-called Myc boxes). Curiously, the STARLING-derived ensemble suggests that Myc1–361 can be divided into two halves (IDR1 and IDR2). IDR1 (Myc1–200) is more compact and engages in intramolecular interactions and some long-range interactions. IDR2 (Myc201–361) is more expanded with locally compact regions. Finally, conformationally distinct subregions align with established Myc-box boundaries, indicating local and long-range conformational properties can align with established functional annotations. Overall, these results predict that Myc1–361 contains strong sequence-encoded biases that may be correlated with (or even underlie) its function.Fig. 4: Biophysical characterization and design applications with STARLING.a, The transcription factor Myc is largely disordered. b, STARLING-derived Myc1–361 ensembles identify distinct subregions that drive attractive and repulsive interactions. The darker colours are closer together, and the lighter colours are further apart. c, The RNA polymerase II CTD consists of a series of heptad repeats. d, STARLING ensembles show excellent agreement with SAXS and all-atom simulations (sims.), enabling polymer theory to describe CTD dimensions with a simple analytical expression. e, Comparison of predicted hydrodynamic radii (Rh) values based on STARLING-derived polymer scaling behaviour (Extended Data Fig. 6g) and Rh values from freely diffusing CTD-only constructs measured in nuclei. f, Histone H1.0 and ProTα form a high-affinity complex together. The H1.0 CTD and ProTα were tethered together by an inert (GS)80 linker. g, The resulting ensemble shows robust H1.0–ProTα interaction. h, The H1.0 CTD and ProTα contract in the complex versus in isolation. i, Comparison of per-residue ProTα–H1.0 CTD contacts and NMR-derived chemical shift perturbations (CSPs) shows excellent agreement. Blue highlighting identifies core binding subregion. j, Nupr1 and ProTα form a complex; we used a shorter (GS)5 linker to enable comparison to SAXS data. k, STARLING-derived ensembles show excellent agreement with Nupr1, ProTα and the Nupr1–ProTα complex. l, The TRPV4 channel has a large N-terminal IDR that contains a basic phosphatidylinositol 4,5-bisphosphate-binding site (PBS). NTD, N-terminal domain. m, STARLING-derived ensembles show good agreement with SAXS data. n, Difference distance map showing the difference in inter-residue distance between the mutant sequence minus the wild-type sequence. Orange colours indicate that distances are further apart in the mutant while blue means that residues are closer together in the mutant than in the wild type. The PBS engages in long-range interactions with a distal acidic region, and mutation of positively charged residues reduces these interactions, in good agreement with extant experimental work. o, STARLING enables systematic prediction of disordered microprotein ensembles. p, Using an optimized latent-space design approach, STARLING enables rapid sequence design to match a desired conformational ensemble. See also Extended Data Fig. 7d–m.The C-terminal domain (CTD) of eukaryotic RNA polymerase II (RPB1) is a large IDR composed of tandem YSPTSPS heptad repeats, whose repeat number varies across species (52 in humans)37 (Fig. 4c). The CTD is believed to function as a multivalent interaction platform for transcriptional regulation. Extensive previous work has shown that low-complexity domains enriched in tyrosine (such as the CTD) are prone to intermolecular and intramolecular interactions, meaning that these domains would be expected to be relatively compact (driven by transient but numerous intramolecular contacts)3. Unexpectedly, previous in vitro work characterized an 81-residue fragment of the CTD with a seemingly highly extended radius of gyration, equivalent to that expected under strongly denaturing conditions (for example, 8 M urea)38 (Extended Data Fig. 6e). This raises an apparent paradox: how can the CTD be simultaneously enriched for tyrosine, poised for intermolecular and intramolecular interactions, yet also appear to behave like a non-interacting, fully denatured polypeptide chain?To answer this question, we generated STARLING ensembles across 26 different CTD lengths, complemented by all-atom Monte Carlo simulations across five lengths. All-atom and STARLING-derived ensembles are in excellent agreement with one another, and with extant SAXS data for CTD variants of length 81 and 312 residues (Fig. 4d). This analysis (see Methods; Extended Data Fig. 6f,g and Supplementary Fig. 3) revealed that the CTD in fact behaves with polymer statistics of an effective Gaussian chain, meaning it is poised to engage in intramolecular and intermolecular interactions39. The seemingly extended nature of the ensemble is driven by the stiffness imparted by the size of the tyrosines and the high proline content (Extended Data Fig. 6h,i). Furthermore, comparisons of CTD dimensions calculated from in-cell single-molecule diffusion data by Ling et al. support a model in which the STARLING-derived CTD dimensions persist in live cells40 (Fig. 4e). These results reconcile previous observations and suggest that in cells, the CTD is primed for intermolecular interactions.We next wondered whether we could tether two different IDRs together with a glycine-serine (GS) linker to investigate pseudo-intermolecular interactions (Fig. 4f). Tethering the C-terminal IDR from the histone H1.0 (H1.097–198) to the histone chaperone prothymosin-α (ProTα) enabled the formation of an electrostatically driven complex between the two proteins (Fig. 4g), as previously reported41. Both proteins contract in the complex (Fig. 4h), consistent with experimental data and theory. Moreover, the specific residues in ProTα identified by nuclear magnetic resonance (NMR)-derived chemical shift perturbations match those residues from the STARLING complex ensemble that drive intermolecular interactions (Fig. 4i). We also investigated the complex between ProTα and the fully disordered 82-residue protein Nupr1 (ref. 42) (Fig. 4j). Here again, we saw agreement with SAXS data for the individual proteins and, using a shorter GS linker, for the disordered bimolecular complex (Fig. 4k). These results indicate that STARLING-derived binary complex ensembles can capture elements of IDR–IDR interaction ensembles.Although our analyses thus far have primarily focused on ensemble differences between very different sequences, we wondered whether STARLING could interpret relatively small amino acid changes. The N-terminal IDR from the transient receptor potential vanilloid 4 (TRPV4) ion channel has a long-range regulatory interaction between a basic phosphatidylinositol 4,5-bisphosphate-binding site and an acidic cluster43 (Fig. 4l). STARLING-derived ensembles of this region show good agreement with SAXS data (Fig. 4m). Moreover, comparing the differences in intramolecular distances between the wild type and a KRWRR-to-AAWAA mutant that reduces long-range interactions in vitro yields a commensurate reduction in long-range interactions in STARLING ensembles (Fig. 4n). These illustrate how STARLING can be used to understand biophysical mechanisms of functional regulation in proteins, even with relatively subtle changes in sequence.We were also interested in investigating the application of STARLING to larger-scale ensemble prediction. Recent work has characterized a large set of microproteins — non-canonical open reading frames typically under 100 amino acids in size — using a combination of mass spectrometry and Ribo-seq-based approaches44. Although these microproteins are highly disordered, they possess distinct amino acid sequence biases from ‘canonical’ open reading frame-derived IDRs (Extended Data Fig. 7a–c and Supplementary Table 6). From 1,785 microproteins in these data, we identified 1,672 IDRs and predicted ensembles for all of them. Although most short IDRs are relatively expanded, many had extensive intramolecular contacts driven primarily between aromatic and arginine residues (Fig. 4o). These results suggest that even short-disordered proteins can possess sequence-encoded conformational biases.Beyond accurate, rapid ensemble prediction, STARLING addresses the inverse-design problem: generating sequences whose conformational ensembles match a chosen target. To do this, we exploited the ensemble-aware sequence representations of the model by implementing a latent-alignment objective that maximizes cosine similarity between target and candidate learned sequence representations using the sequence optimization framework in GOOSE (see Methods)26. This allowed us to quickly design in this ensemble-aware latent space, rather than generating ensembles in 3D, enabling the rapid optimization of bespoke disordered sequences with prescribed ensemble properties.As a proof of concept, we used STARLING in conjunction with our IDR design framework, GOOSE to design 100 sequences targeting a short IDR from the protein CTCF (CTCF590–629; UniProt ID: P49711)26. Starting from length-matched GS sequences, generation averaged 0.7 s per sequence with high structural accuracy (mean absolute error of 0.94 Å; average Hamming distance of 35; Extended Data Fig. 7d). Furthermore, we found that ensemble-matching designs can be generated within tens of seconds, even for long sequences (Extended Data Fig. 7e–m and Supplementary Fig. 4). These results, alongside performance tests on longer sequences, demonstrate that STARLING enables rapid, systematic design of IDRs with specific conformational properties.Predictions up until this point have focused on ensemble generation at 150 mM ionic strength. However, the STARLING sequence encoder was explicitly conditioned on ionic strength (see Methods). Consequently, STARLING can also generate ensembles at ionic strengths between 20 mM and 300 mM (Fig. 5a).Fig. 5: STARLING enables solution-dependent ensemble generation, Bayesian reweighting and ensemble-aware embedding for search.a, Schematic representation of sequence-dependent changes in conformational behaviour in response to changes in ionic strength for a blocky polyampholytic sequence. b, STARLING-derived ionic-strength-dependent Re distributions for a highly charged, ionic-strength-responsive sequence. Mpipi-GG simulations shown as a kernel density estimate plot. In each subpanel, we show H and the KS statistic to quantify the difference between distributions and the effect size of the difference. A KS statistic of 0.03 means the CDFs of the two distributions differ by at most 3%. c, Re correlation between the STARLING and Mpipi-GG simulations performed at various ionic strengths for the highly charged Das–Pappu sequences. Despite being trained only at three different ionic strengths, STARLING can interpolate across ionic strengths unseen during training. d, AFRC-normalized average inter-residue distance maps for STARLING (upper) compared with Mpipi-GG simulations (lower) across five different ionic strengths. e, Schematic representation of incorporating experimental data into STARLING for integrative biophysical modelling. f, Reweighting based on single-molecule Förster resonance energy transfer (smFRET) data for Re improves agreement with SAXS data (Rg), highlighting how ensemble reweighting through one modality can improve agreement with others. Exp., experiment. g, Schematic representation of the ensemble-aware latent embedding of STARLING as used for sequence search. h, Heatmap of the ratio (candidate:query) of average inter-residue distance maps for the fully disordered query protein SERF Saccharomyces cerevisiae (UniProt ID: Q3E7B7). The upper triangle shows the top-ranked candidate; the lower triangle shows the lowest-ranked candidate, where candidates were ranked by cosine similarity of their embedding maps to the query SERF after scanning a database of IDRs from UniRef50. The colours indicate deviation from SERF: white ≈ 1.0 (similar), purple < 1.0 (more compact) and orange > 1.0 (more expanded). Serendipitously, the most and least similar candidates are equidistant from SERF in terms of sequence changes.To assess how well STARLING captures ionic-strength dependence — as defined by the underlying Mpipi-GG model — we analysed 30 strong polyampholytic sequences consisting solely of lysine and glutamate with distinct charge patterning (‘Das–Pappu sequences’)45. Figure 5b shows the end-to-end distance distributions from STARLING and Mpipi-GG at the three ionic strengths used during training, showing excellent agreement as measured by both the H and the KS statistic (note that these are not fitted to one another). This trend holds across the Das–Pappu sequence variants (Extended Data Fig. 8a,b).We next asked whether our ionic-strength model, conditioned with three anchor points (ionic strength of 20 mM, 150 mM and 300 mM), would generalize to new ionic strengths not seen in training. We evaluated 16 ionic strengths spanning 20–300 mM (13 never seen in training) and analysed the mean end-to-end distance of each ensemble. STARLING interpolates smoothly between the three training ionic strengths and reproduces Mpipi-GG means with high concordance (Pearson r = 0.98; Spearman ρ = 0.97; Fig. 5c). Beyond just global dimensions, normalized distance maps compared between ensembles generated via STARLING and Mpipi-GG simulations revealed that STARLING accurately learns the ionic-strength-dependent changes in the underlying conformational distributions of inter-residue distances (Fig. 5d and Extended Data Fig. 8c). Furthermore, STARLING can qualitatively reproduce ionic-strength dependence of the ProTα–H1.0CTD interaction41 (Extended Data Fig. 8d–f). Together, these results suggest STARLING can be used to investigate solution-dependent IDR interactions using a limited number of anchor points and interpolating between them.Although STARLING aligns with Mpipi-GG and experimental data, it is not a substitute for rigorous biophysical measurements. Instead, experiments can complement STARLING by providing restraints to refine and integrate into IDR ensembles via two routes. The first route uses guidance during ensemble generation to push conformers towards target observables (see Methods; Extended Data Fig. 9a–c and Supplementary Fig. 5), an approach well-suited for generating ensembles far from the unbiased distribution (for example, cyclic peptides), although guided ensembles likely deviate from the canonical ensemble. The second route uses Bayesian maximum entropy (BME) reweighting — reimplemented natively within STARLING — to reweight ensembles to match experimental observables15. BME treats the STARLING ensemble as the prior and incorporates data (for example, SAXS and smFRET) through a likelihood-based restraint with uncertainties, yielding ensembles that better match experiment (Fig. 5e). As a proof of concept, we used BME to reweight four of the ensembles for sequences measured by Holla et al.34, treating the experimental end-to-end distance as a restraint in the BME objective. The resulting ensembles not only improve agreement with end-to-end distance but also agreement with the SAXS-derived Rg (Fig. 5f). These results suggest that STARLING provides a powerful and easy-to-use platform for integrative modelling of experimental data of IDRs.Finally, beyond the strict generation of ensembles, a novel application enabled by the unique architecture of STARLING is the ability to perform fast, large-scale disordered-protein biophysical ensemble-similarity search directly from sequence (Fig. 5g). By encoding sequences into a conformationally aware latent space using the sequence encoder (Extended Data Fig. 2d), search can be performed within this embedded space, enabling the identification of conformationally similar IDRs.As a proof of principle, we created a database of all predicted IDRs in UniRef50 with fewer than 380 residues (approximately 35 million sequences). We then created STARLING ensemble-aware embeddings for each of these sequences, implementing a methodology for rapid, large-scale approximate nearest-neighbour search (see Methods). We tested this approach by querying the protein SERF (UniProt ID: O75920) against this database46 (Fig. 5g). Next, we extracted the candidate with the most similar and least similar vector embeddings and built ensemble-averaged distance maps for each construct. Normalizing each of these candidates by the query protein SERF reveals that the most similar length-matched candidate has a highly similar averaged pairwise distance map (Fig. 5h). By contrast, the least similar length-matched candidate has stark differences with subregions that are both overly compact and overly expanded. Together, the STARLING sequence encoder enables IDR sequences to be represented in a high-dimensional conformationally aware space, with a broad range of potential applications, from design (Fig. 4p) to search (Fig. 5g,h) to the development of new protein representations that combine IDR-specific embeddings with general protein language embeddings.Overall, these vignettes demonstrate the versatile range of applications that STARLING enables. Of note, the speed and ease with which STARLING generates ensembles mean that these investigations can be accomplished in hours or even minutes.