
Remember me




I had expected to use Beszel, an open-source server monitoring app, on my Linux servers, but, in all honesty, that’s not where it was most needed. My problem machine was a Windows Server 2022 VM that I used frequently as a centralized workplace while traveling.
This particular virtual machine has a nasty habit of constantly maxing its allocated compute regardless of what I throw at it. That meant I was constantly opening PowerShell just to see if maxed-out CPU, memory, and disk activity were responsible for the slow Windows performance.
Beszel gave me a surprise fix. It didn’t replace PowerShell's functionality for everyday work, but it stopped me from having to open it and run multiple commands.
 Related
The Windows setup was much easier than I expected
Hub, agent, and browser, done
Related
The Windows setup was much easier than I expected
Hub, agent, and browser, done
 Close
Close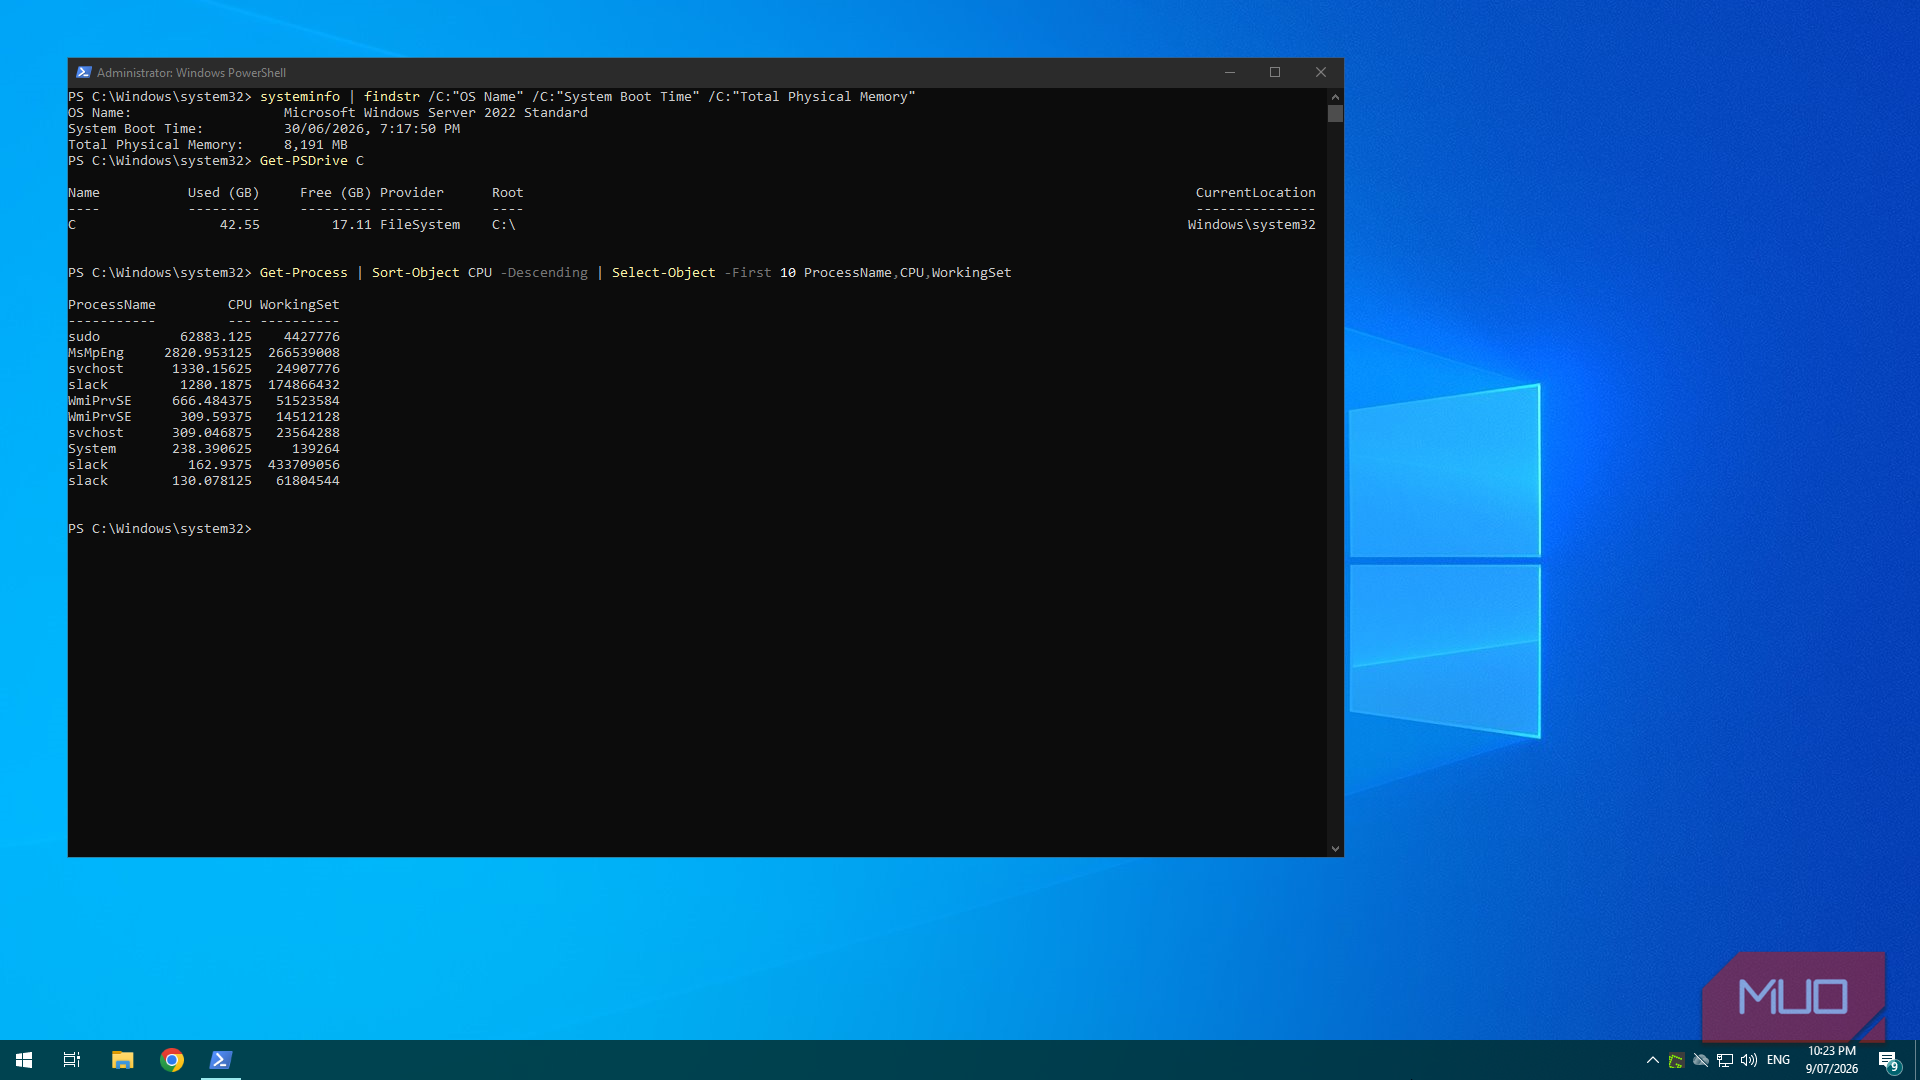
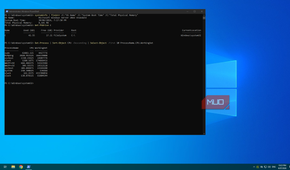
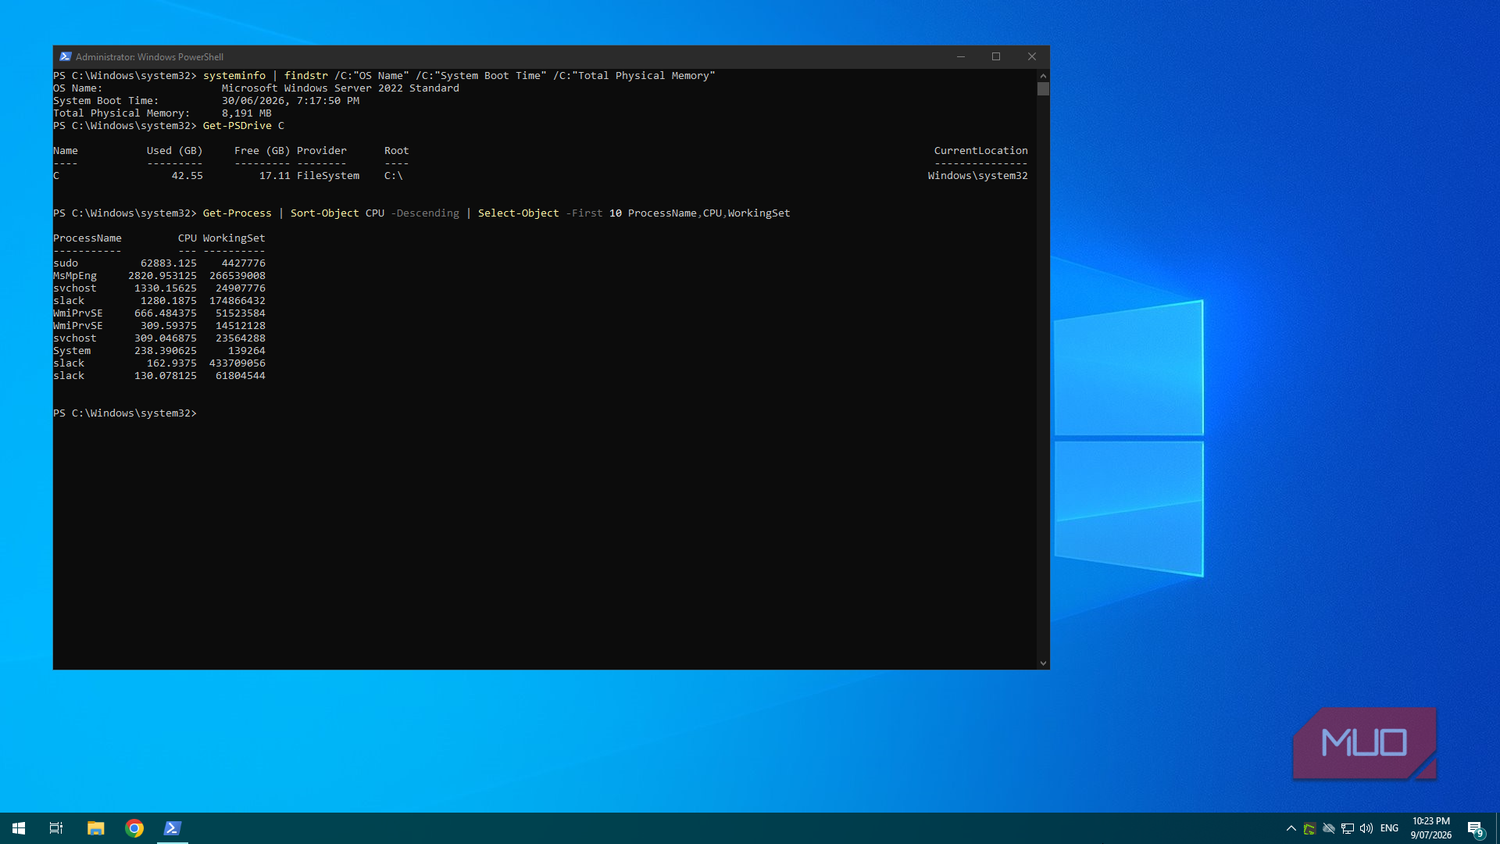
Checking my system performance in PowerShell wasn’t exactly laborious. It was just something I was tired of having to copy a command from my list of commonly used PowerShell commands and open PowerShell on an already struggling system when I just needed a glance at what was going on:
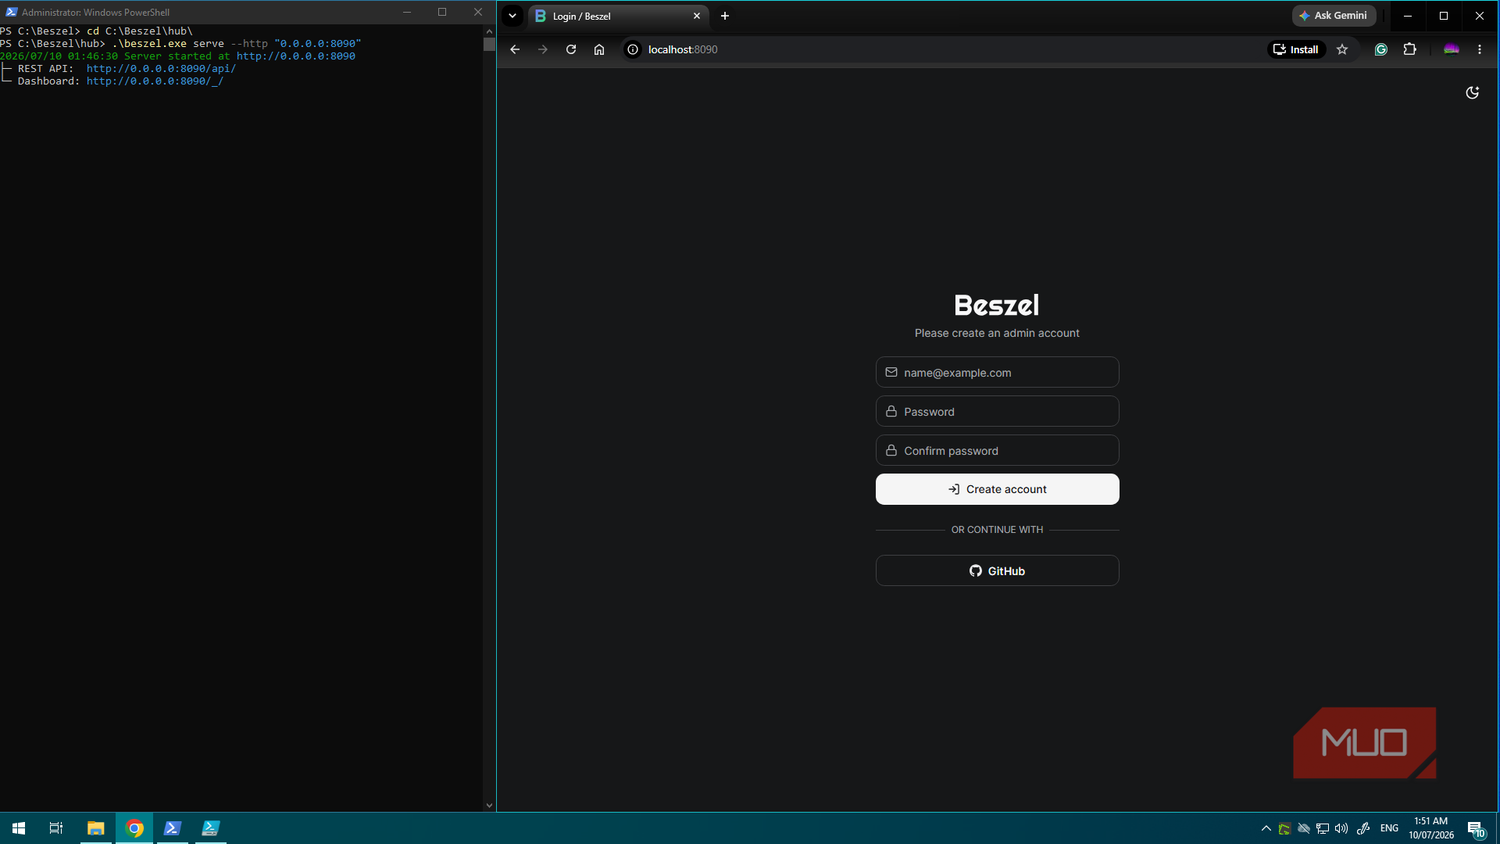
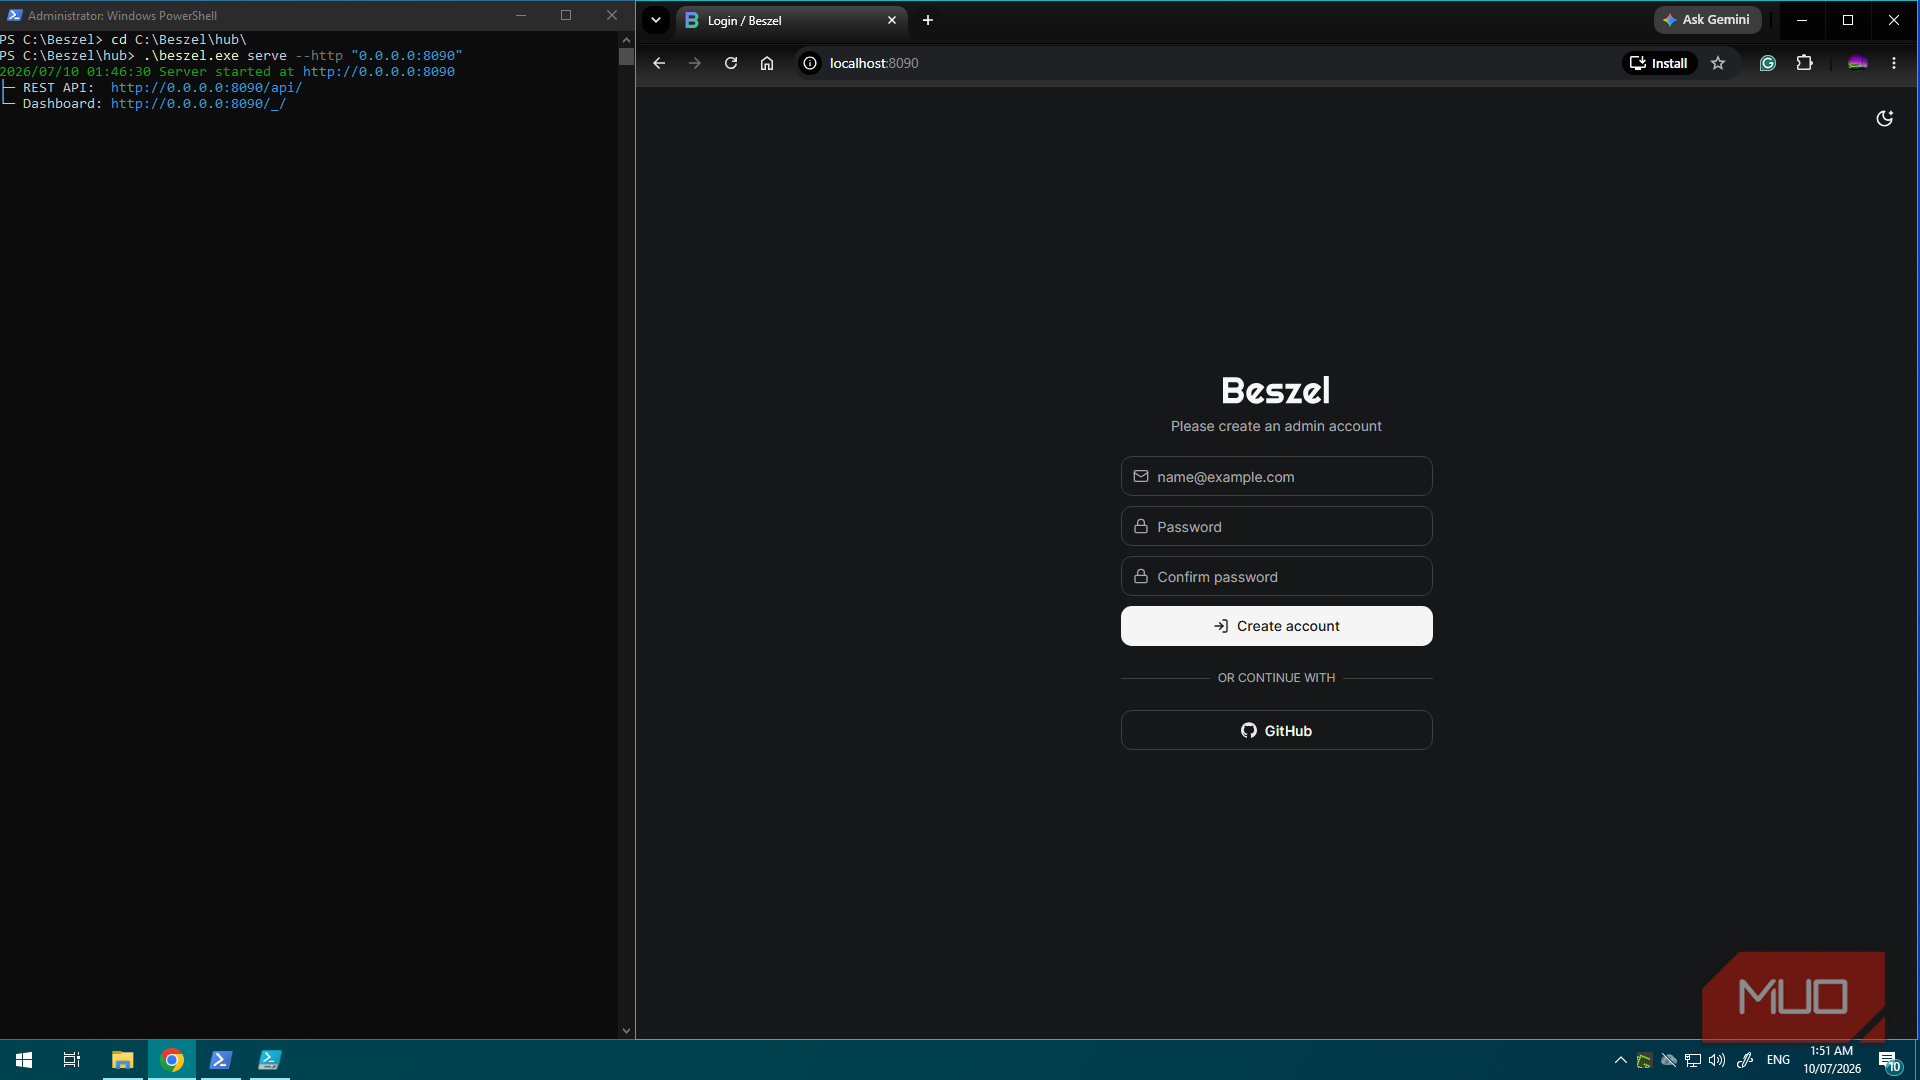
systeminfo | findstr /C:"OS Name" /C:"System Boot Time" /C:"Total Physical Memory" Get-PSDrive C Get-Process | Sort-Object CPU -Descending | Select-Object -FirstI went into this expecting it to be hard because Beszel is primarily used on Linux, and I figured the Windows port was going to be trouble by default. Installing the Beszel hub turned out to be really easy. I created a folder, downloaded the latest Windows build, extracted it, and ran it from PowerShell as an administrator:
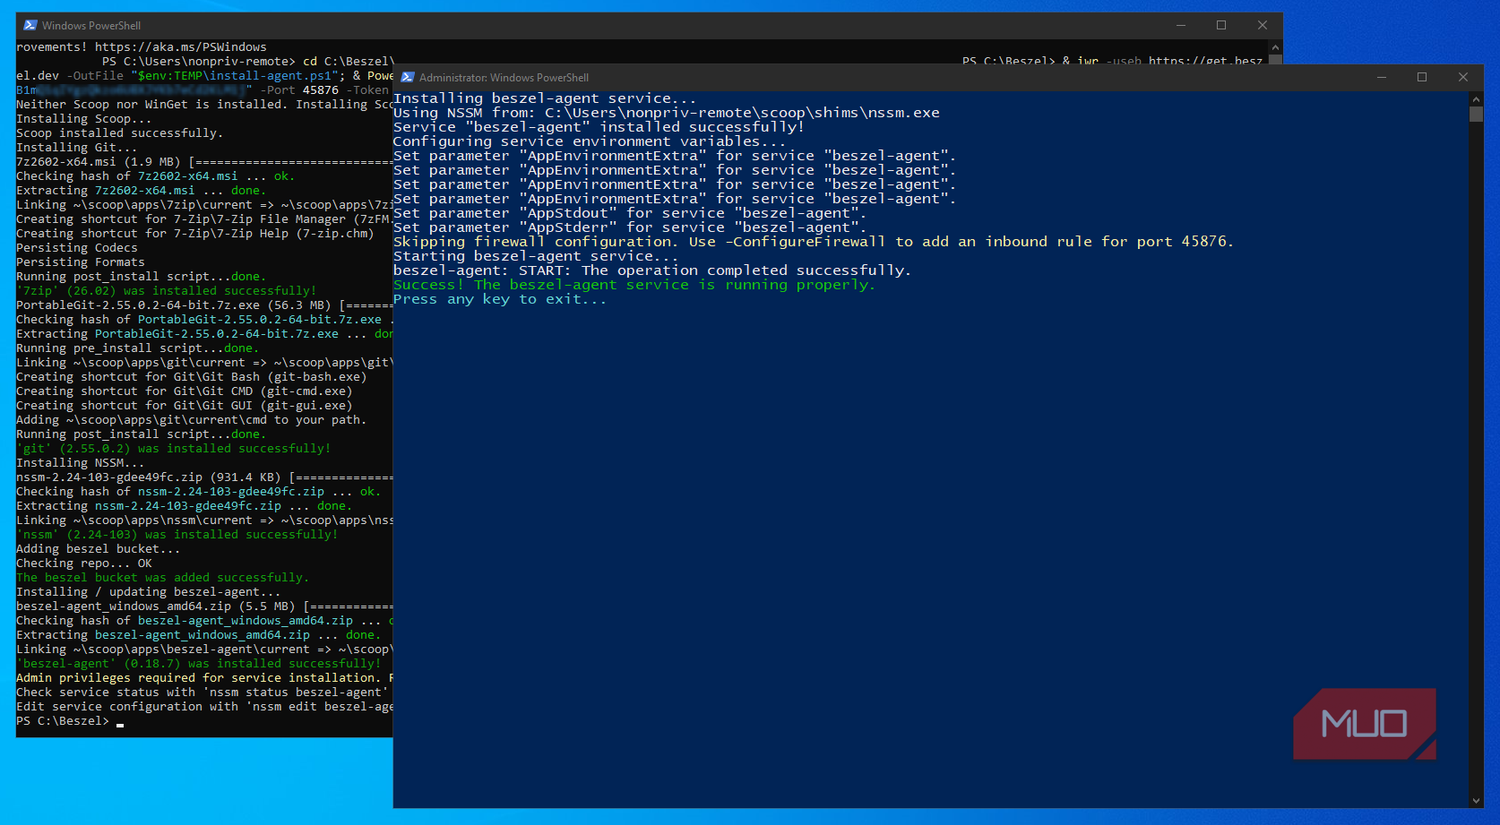
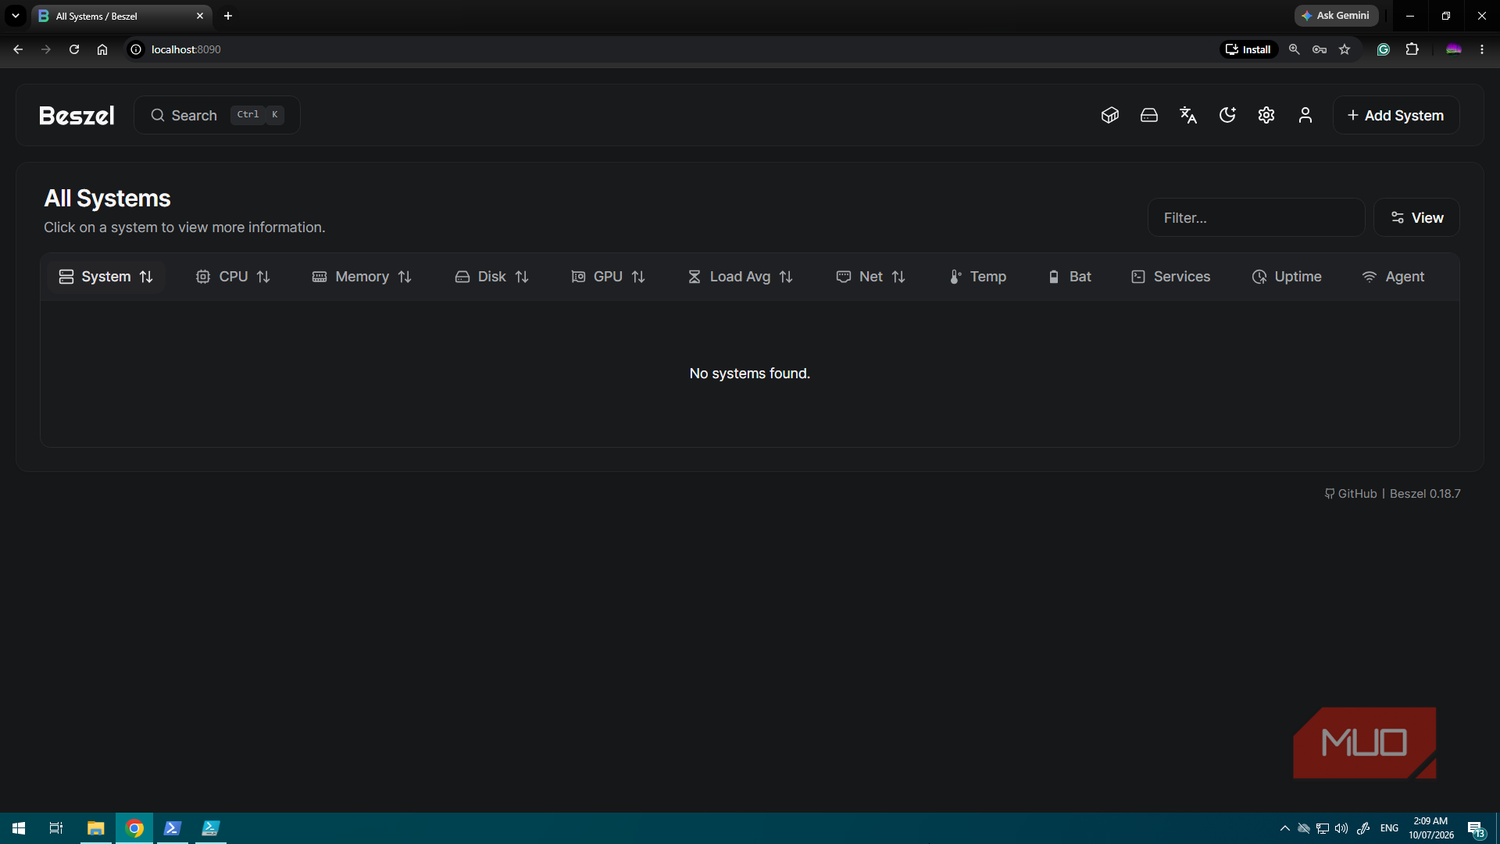
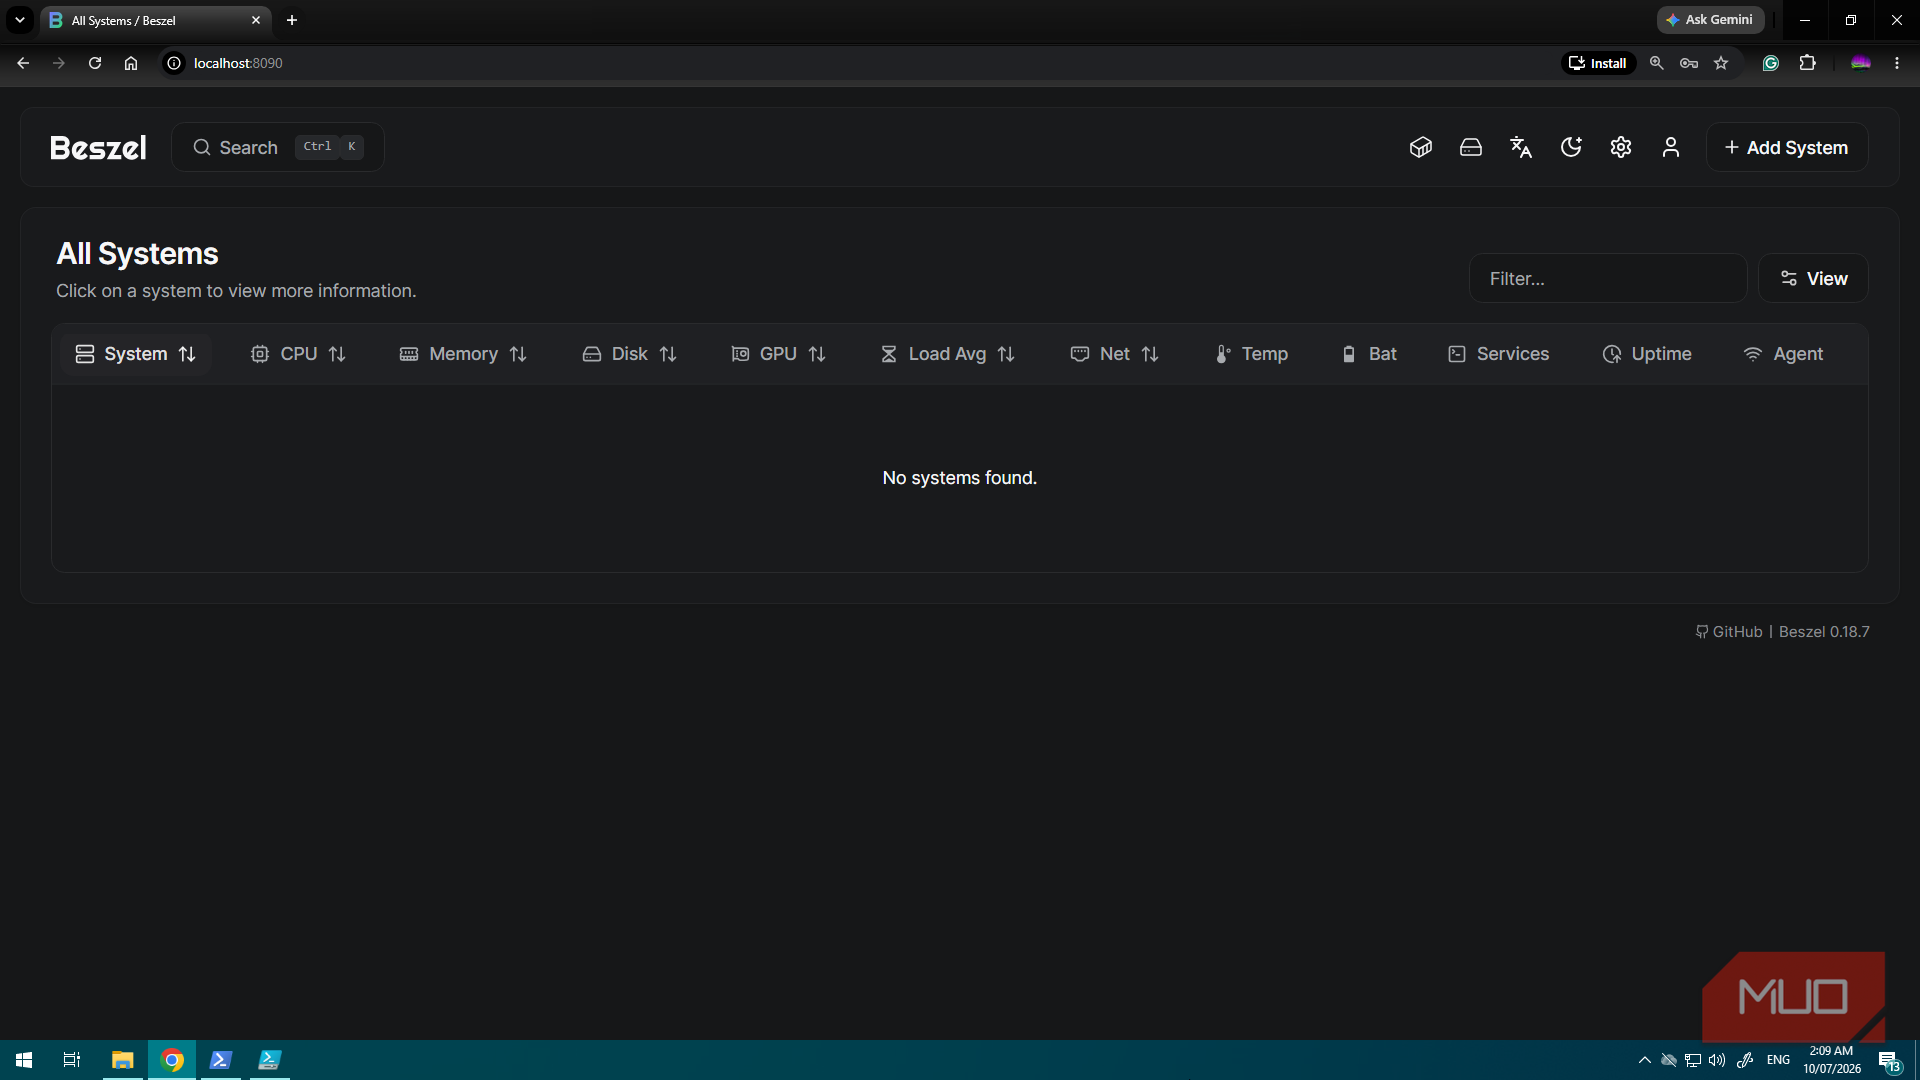
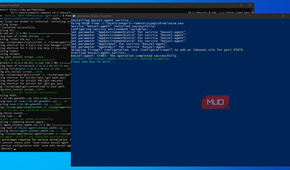
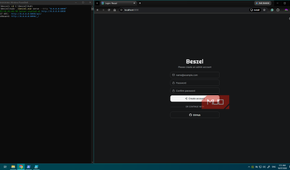
Invoke-WebRequest ` -Uri "https://github.com/henrygd/beszel/releases/latest/download/beszel_windows_amd64.zip" ` -OutFile "beszel_windows_amd64.zip" Expand-Archive .\beszel_windows_amd64.zip -DestinationPath .\hub -Force cd .\hub .\beszel.exe serve --http "0.0.0.0:8090"After that, I simply opened http://localhost:8090, created the first admin account, and added my VM as a monitored system. Beszel can run as a single binary or via Docker and Podman, and I ended up choosing the Windows binary to provide a more native installation experience.
When creating the first admin account, use a real email address, as this is where Beszel will send notifications about high resource usage.
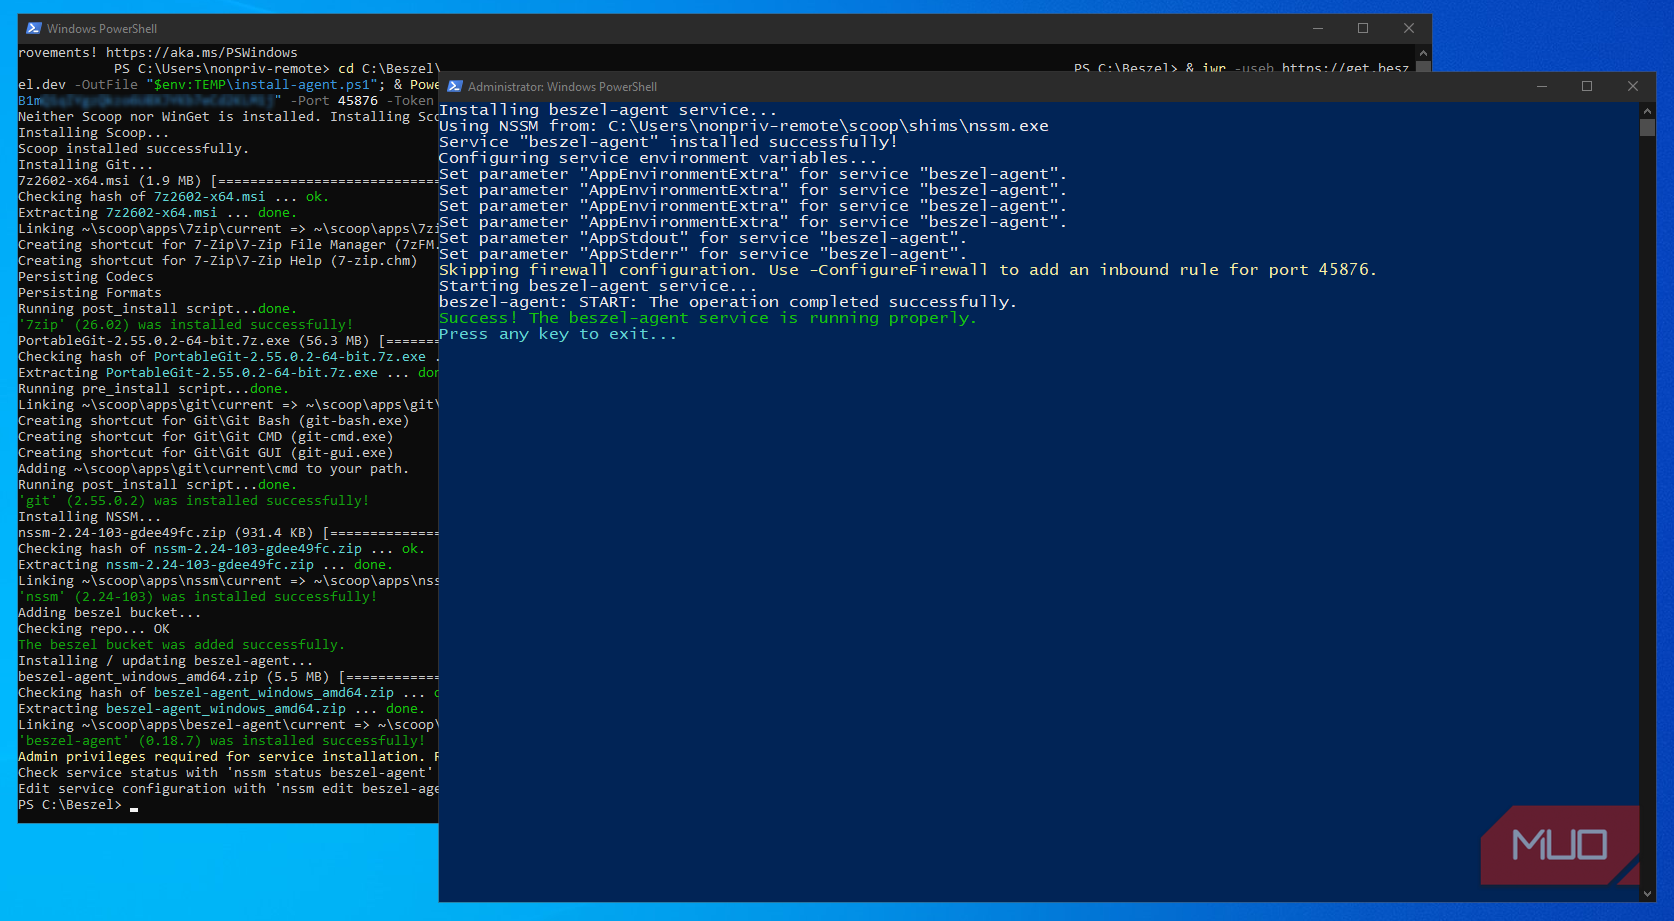
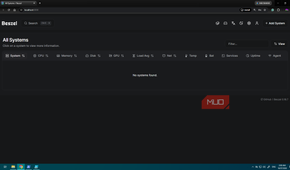
When I added the Windows system to Beszel, the process generated a public key and token and gave me a copy-and-paste installer command for the Windows agent:
& iwr -useb https://get.beszel.dev -OutFile "$env:TEMP\install-agent.ps1"; ` & Powershell -ExecutionPolicy Bypass -File "$env:TEMP\install-agent.ps1" ` -Key "ssh-ed25519 [redacted]" ` -Port 45876 ` -Token "[redacted]" ` -Url "http://localhost:8090"Executing that command downloaded the agent installer, passed in the hub URL, key, token, and port, then connected the VM back to Beszel. Once the agent was running, the Beszel dashboard was populated with the stats I needed about the system and more.
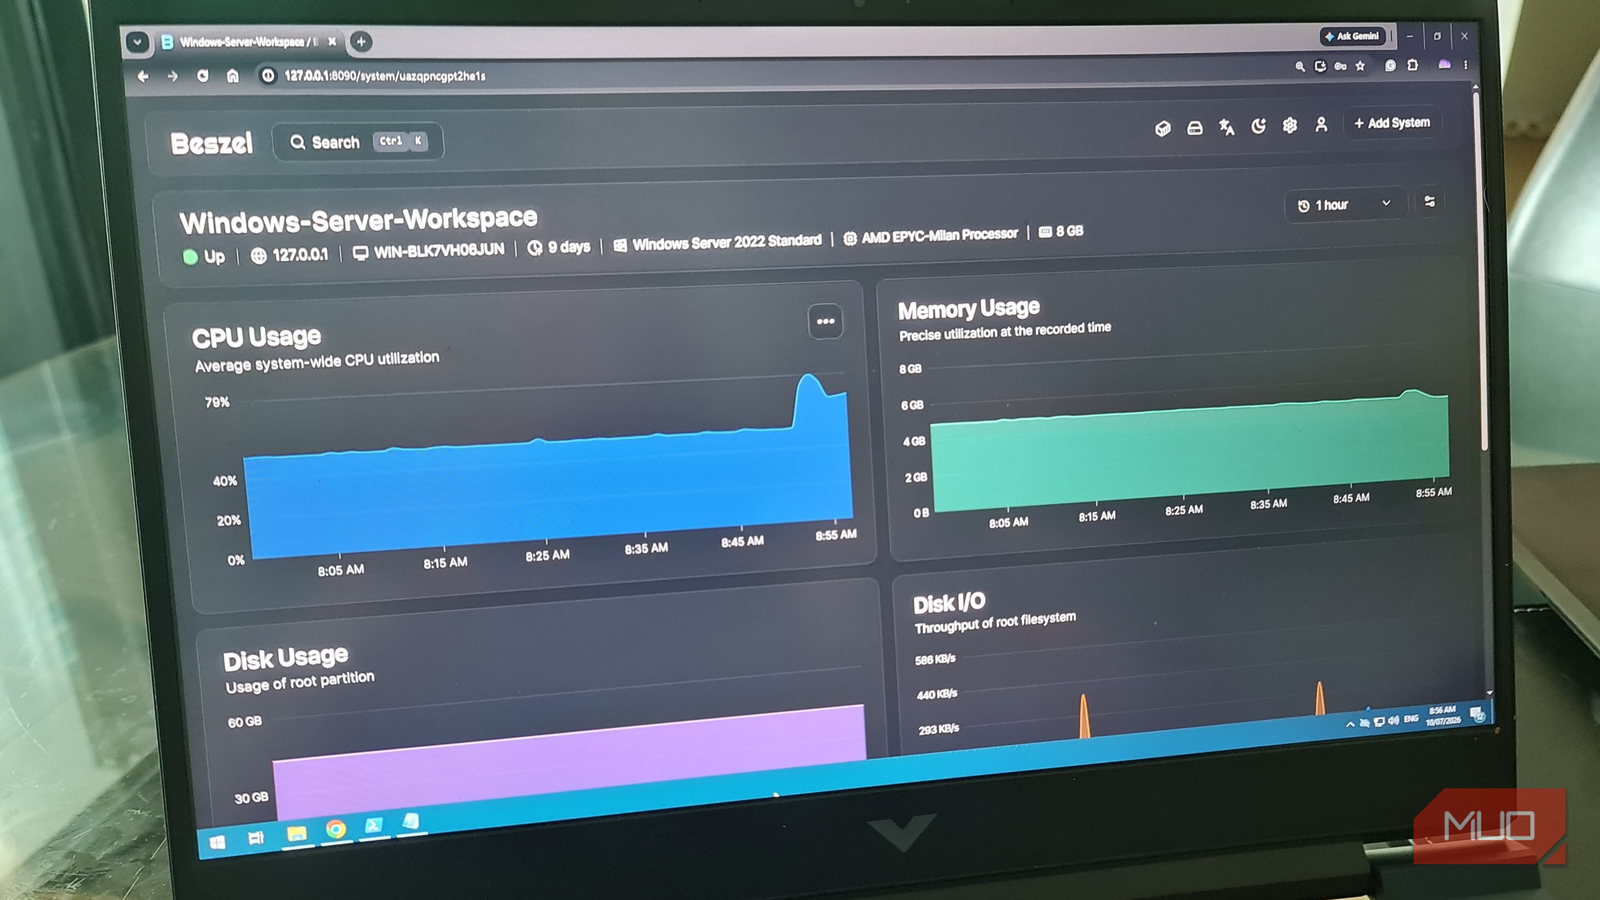
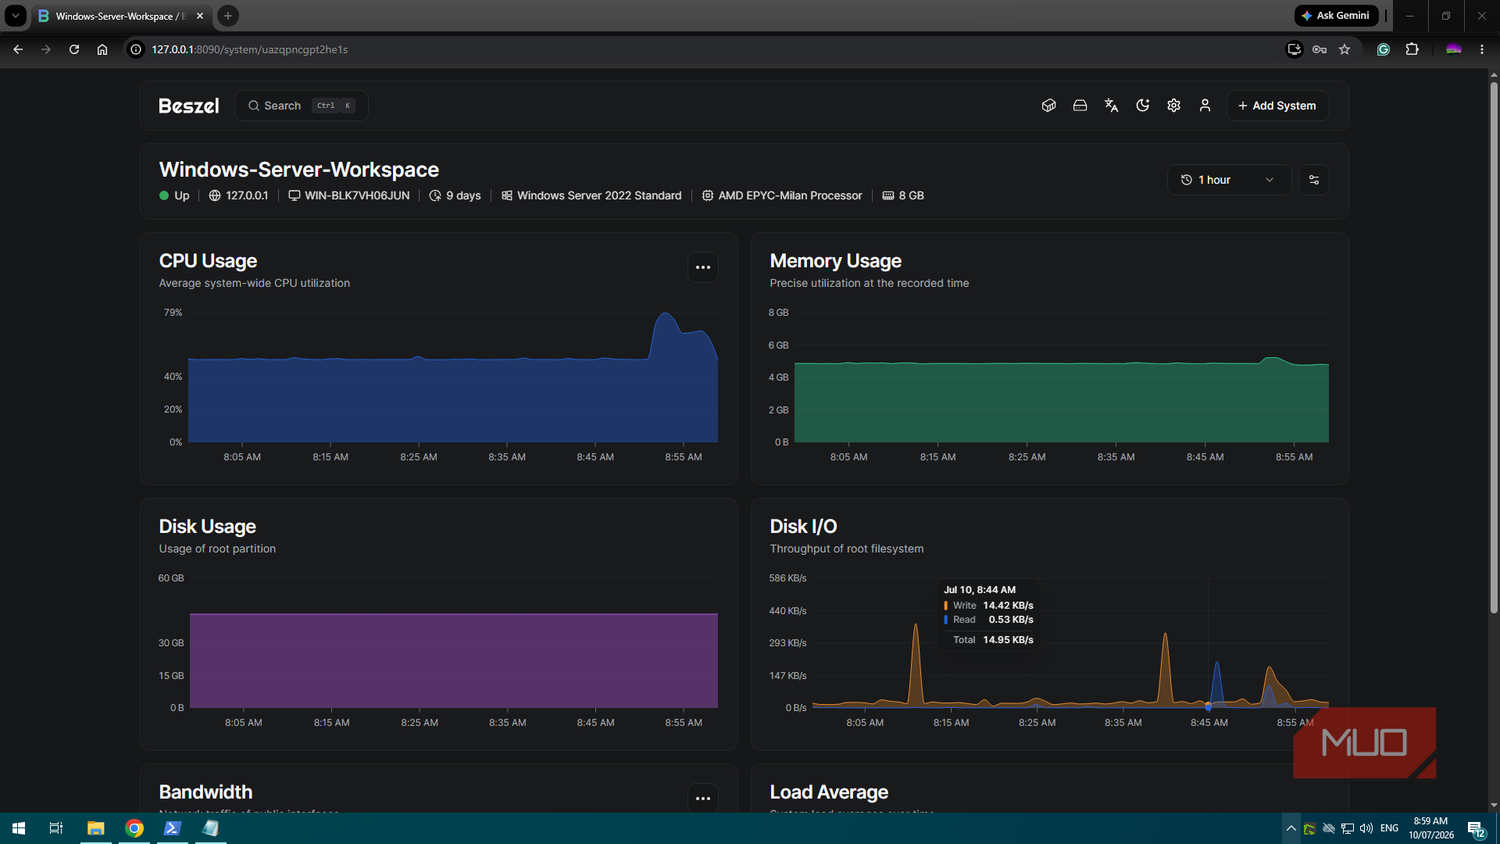
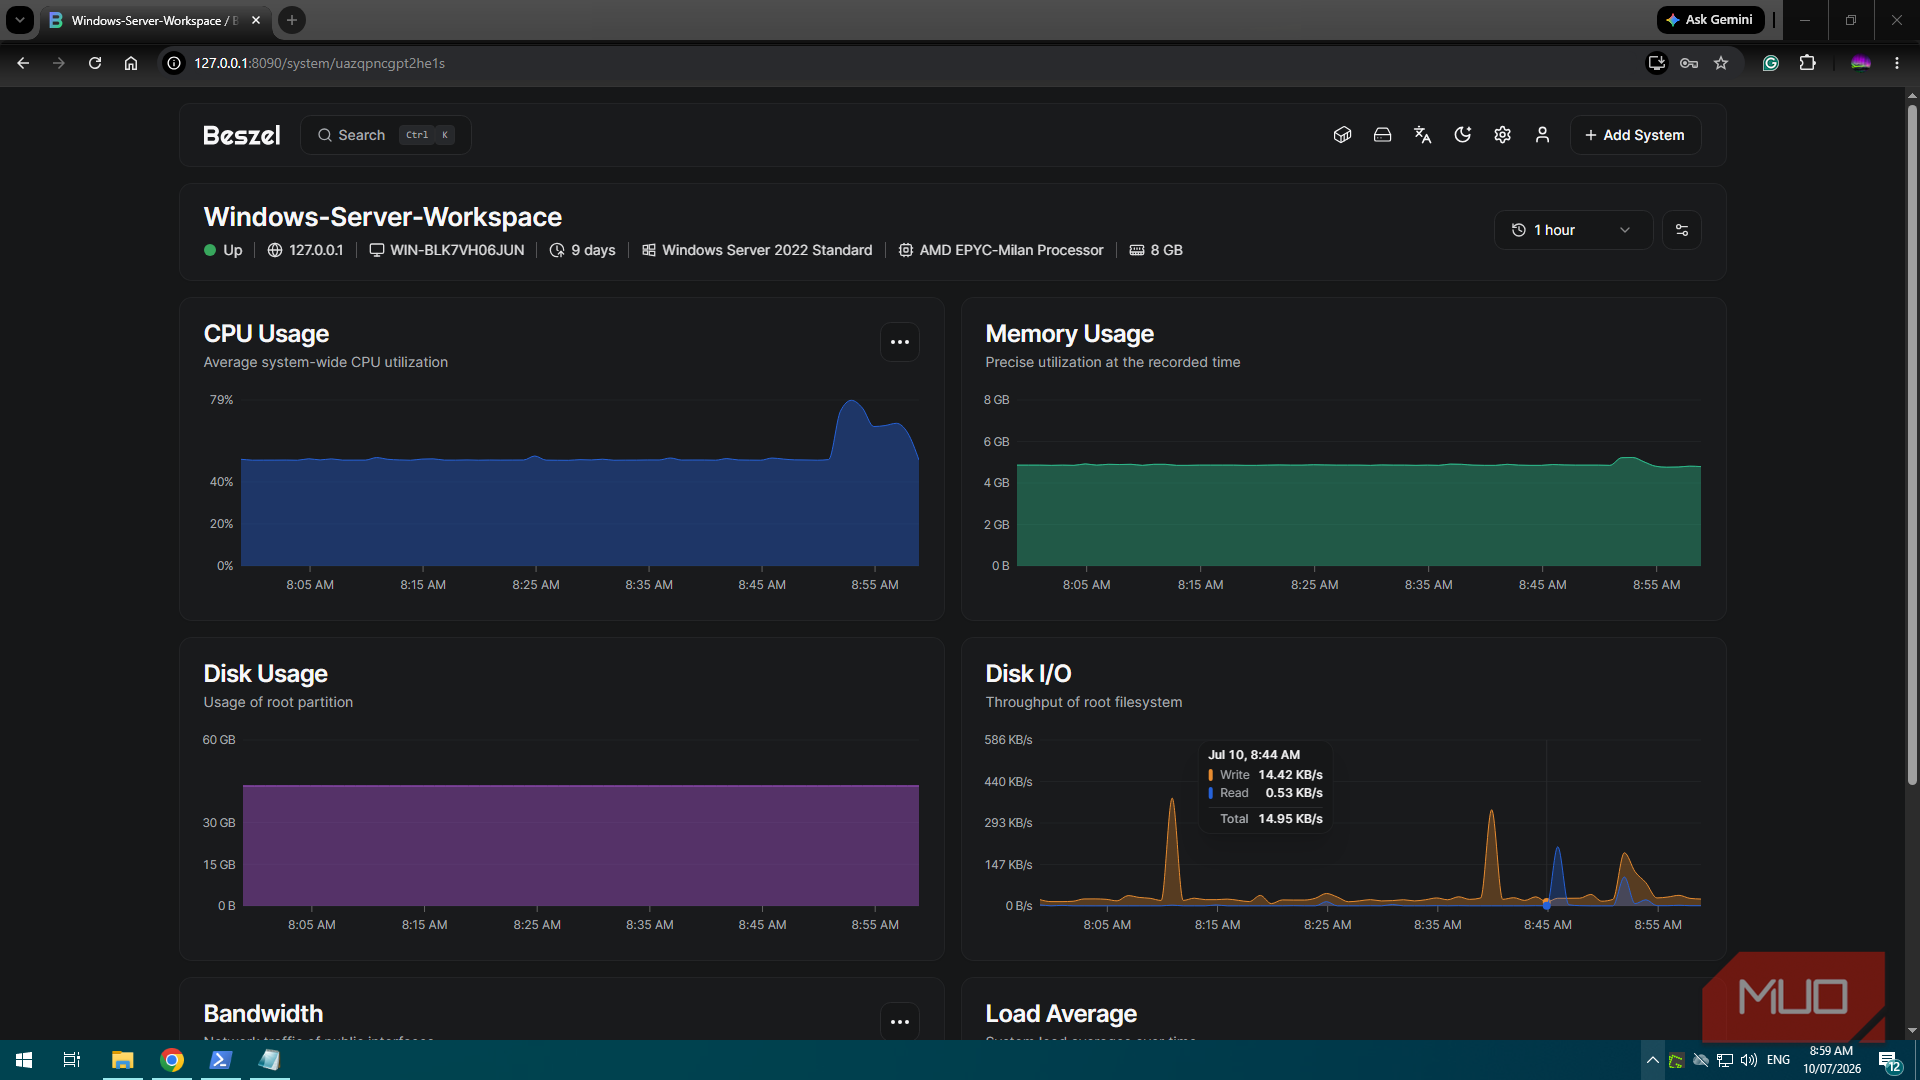
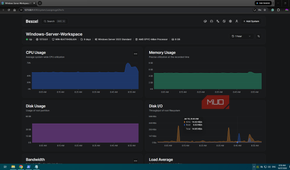
Beszel gave me the stats that I kept opening the terminal to check CPU, memory, disk, network, and enough history to pinpoint exactly when things started going wrong
The biggest change wasn’t that Beszel gave me access to information I could already get through PowerShell. The difference was that I could just see it all at once, as you can with apps like Rainmeter.
On this particular virtual machine, that was important because I was often checking out of suspicion and not out of boredom or curiosity. When Windows started slowing down, as it often does, I wanted to know whether it was the CPU, memory, or disk getting hammered, or just the network. Beszel put all that on one page, accessible by a browser outside the VM, with historical and real-time data.
For my Windows setup, Beszel gave me all of this at a glance:
CPU usage Memory usage Network activity Uptime and system status Historical graphing up to one month agoOf most interest to me was the historical data. Because I could take a mental note, or write down times the system was freezing or barely able to open a browser tab, and go back through the graphs to find what virtual hardware was actually struggling. Then I could just allocate more compute resources as needed from my ESXi hypervisor to address the issue.
Making it persistent was the only part left to fix The hub worked, but I still had to make it survive a Windows reboot
This was the very “Windows” step of the process. On Linux, I could simply make a new systemd service, but on Windows, I needed to make a startup script:
New-Item -ItemType Directory -Force C:\Beszel\logs @' Set-Location "C:\Beszel\hub" & "C:\Beszel\hub\beszel.exe" serve --http "0.0.0.0:8090" *> "C:\Beszel\logs\beszel-hub.log" '@ | Set-Content C:\Beszel\start-beszel-hub.ps1Then I registered that script as a startup task, running as SYSTEM, so it would start even before I had logged in:
$Action = New-ScheduledTaskAction ` -Execute "powershell.exe" ` -Argument '-NoProfile -ExecutionPolicy Bypass -File "C:\Beszel\start-beszel-hub.ps1"' $Trigger = New-ScheduledTaskTrigger -AtStartup Register-ScheduledTask ` -TaskName "Beszel Hub" ` -Action $Action ` -Trigger $Trigger ` -User "SYSTEM" ` -RunLevel HighestThen I just started it manually:
Start-ScheduledTask -TaskName "Beszel Hub"It wasn’t the most elegant solution, but it worked. After a test reboot, Beszel came back on localhost:8090, and the dashboard loaded again with just a brief gap in the graphs where the restart happened.
I still need the terminal when something actually breaks Beszel changed my checking habit, not my troubleshooting tools
I still need to use the Windows PowerShell terminal. It’s a powerful tool and still one of the first things I reach for when something breaks. If a service goes down in classic Windows fashion, I’m going back to PowerShell. If I need to debug a bad config, inspect firewall rules, restart a frozen service, or just fix whatever annoying issue Windows is giving me today, I’ll be firing up PowerShell and not looking at Beszel.
And that’s totally fine, because PowerShell itself was never the problem. Using it like a dashboard certainly was, though. I installed Beszel because I was tired of opening PowerShell or even Task Manager just to check if the system was okay.
This is also where the Beszel alerting functionality wins over using PowerShell as a dashboard. Beszel allowed me to set thresholds for every resource monitored on the system. If the CPU, memory, or any monitored resource I care about crosses a threshold, I receive an email notification. It’s just much simpler and beats checking system stats in PowerShell every five minutes to catch when it spikes.
That's the real reason I am keeping Beszel
Beszel has earned a permanent place on my Windows VM because it solved an annoyance that happened far too often. It’s not a full Grafana-style monitoring setup, and I’m not going to pretend it can replace troubleshooting. But that’s not why I actually installed it.
It works really well as a quick, readable status page for my Windows VM, and I can even add more machines to it in the future (I likely will) if they run Podman or Docker.
The Windows PowerShell terminal is still there when I need it. I just opened it with reason and purpose now.
 Related