Mexico City is SINKING: NASA satellite reveals how the city is subsiding by 10 inches per year - leaving 22 million people at risk
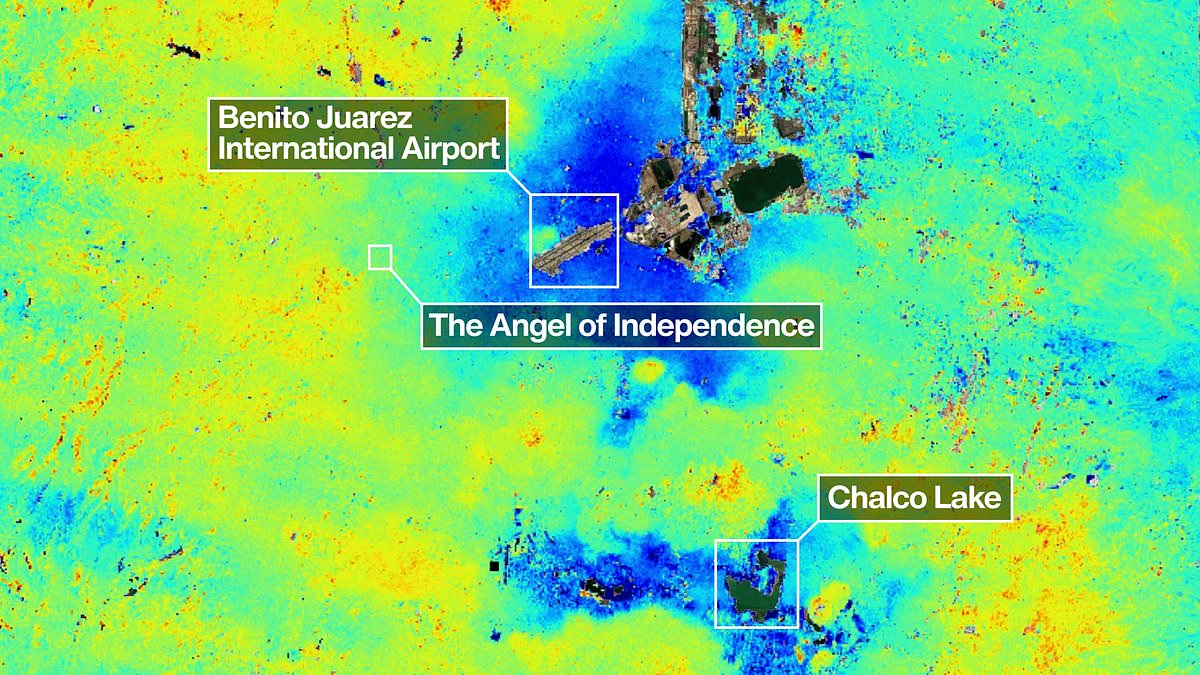
Mexico City is sinking so quickly it can be seen from space, new images reveal.Satellite photos released by NASA show the metropolis is subsiding by up to 10 inches (25cm) per year.Extensive groundwater pumping and urban development have dramatically shrunk the ancient lakebed the Mexican capital sits upon.As a result, the metropolis – home to some 22 million people – has been sinking for more than a century.Many monuments and older buildings, such as the Metropolitan Cathedral, have been left visibly tilted to the side.It is also leading to a chronic water crisis that is only expected to worsen.'It damages part of the critical infrastructure of Mexico City, such as the subway, the drainage system, the water, the potable water system, housing and streets,' said Enrique Cabral, a researcher studying geophysics at the National Autonomous University of Mexico.'It's a very big problem.' Parts of the region found to be subsiding by more than half an inch (more than 2cm) per month are shown in dark blueThe issue was first documented by an engineer in 1925 and, by the 1990s and 2000s, parts of the city were sinking by around 14 inches (35cm) per year.NASA's newly released report shows that the subsidence is now happening at an average rate of 0.78 inches (2cm) per month, in areas such as the main airport and the Angel of Independence monument.Overall, this means a yearly sinking rate of about 9.5 inches (24cm), experts said – and over the course of 100 years this has added up to more than 39 feet (12 metres).'We have one of the fastest velocities of land subsidence in the whole world,' Dr Cabral said.The NASA estimates are based on measurements taken between October 2025 and January 2026 by a powerful satellite known as NISAR, which can track real–time changes on the Earth´s surface.NISAR scientist Paul Rosen said that by capturing details of the Earth from space, the project is also 'telling us something about what´s actually happening below the surface'.'It's basically documentation of all of these changes within a city. You can see the full magnitude of the problem,' he said.The Angel of Independence landmark, built in 1910 to commemorate 100 years of Mexico's independence, stands at 114 feet (36m) high but has had 14 steps added to its base as the land around it gradually sinks. Pedestrians walk past a slightly tilted historic building in downtown Mexico City. The metropolis was built on a drained lake bed and many buildings are noticeably tilted from sinking unevenly into the soft earth over decades or centuries The Angel of Independence landmark, built in 1910 to commemorate 100 years of Mexico's independence, stands at 114 feet (36m) high but has had 14 steps added to its base as the land around it gradually sinksIn Mexico City, the technology represents a huge advance in studying the issue of subsidence and mitigating its worst effects.For decades the government has largely ignored the problem other than stabilizing foundations under monuments like the cathedral, Dr Cabral said.But following recent flare–ups of the water crisis, officials have begun to fund more research.With time the team hope to be able to zoom in even more on specific areas and one day get measurements on a building–by–building basis.More broadly, researchers hope to apply the technology around the world to track things like natural disasters, changes in fault lines, the effects of climate change in regions like Antarctica and more.Dr Rosen said it could be used to bolster alert systems, letting scientists alert governments to the need for evacuations in cases of volcano eruptions, for example.'Mexico City is a well–known hot spot when it comes to subsidence, and images like this are just the beginning for NISAR,' said David Bekaert, a project manager at the Flemish Institute for Technological Research and a member of the NISAR science team.'We're going to see an influx of new discoveries from all over the world, given the unique sensing capabilities of NISAR and its consistent global coverage.' Scientists have previously used satellite maps to work out how many buildings would be destroyed if sea levels rise between 0.5 metres (red) and 20 metres (yellow). In the worst–case scenario, over 100 million buildings would be flooded in the global south alone The NISAR satellite is monitoring the Earth's land and ice surfaces twice every 12 days.It collects data using the spacecraft's giant drum–shaped reflector, which measures 39 feet (12m) wide – making it the largest radar antenna reflector NASA has ever sent into space.The radar can work day and night, rain or shine, to track subtle motions such as land sinking and rising, glaciers sliding, and croplands growing.'NISAR's long wavelength L–band radar will make it possible to detect and track land subsidence in more challenging and densely vegetated regions such as coastal communities where they may have the compounding effects of both land subsidence and sea level rise,' said Craig Ferguson, deputy project manager at NASA Headquarters in Washington.GLACIERS AND ICE SHEETS MELTING WOULD HAVE A 'DRAMATIC IMPACT' ON GLOBAL SEA LEVELSGlobal sea levels could rise as much as 10ft (3 metres) if the Thwaites Glacier in West Antarctica collapses. Sea level rises threaten cities from Shanghai to London, to low-lying swathes of Florida or Bangladesh, and to entire nations such as the Maldives. In the UK, for instance, a rise of 6.7ft (2 metres) or more may cause areas such as Hull, Peterborough, Portsmouth and parts of east London and the Thames Estuary at risk of becoming submerged.The collapse of the glacier, which could begin with decades, could also submerge major cities such as New York and Sydney.Parts of New Orleans, Houston and Miami in the south on the US would also be particularly hard hit.A 2014 study looked by the union of concerned scientists looked at 52 sea level indicators in communities across the US.It found tidal flooding will dramatically increase in many East and Gulf Coast locations, based on a conservative estimate of predicted sea level increases based on current data.The results showed that most of these communities will experience a steep increase in the number and severity of tidal flooding events over the coming decades.By 2030, more than half of the 52 communities studied are projected to experience, on average, at least 24 tidal floods per year in exposed areas, assuming moderate sea level rise projections. Twenty of these communities could see a tripling or more in tidal flooding events.The mid-Atlantic coast is expected to see some of the greatest increases in flood frequency. Places such as Annapolis, Maryland and Washington, DC can expect more than 150 tidal floods a year, and several locations in New Jersey could see 80 tidal floods or more.In the UK, a two metre (6.5 ft) rise by 2040 would see large parts of Kent almost completely submerged, according to the results of a paper published in Proceedings of the National Academy of Science in November 2016.Areas on the south coast like Portsmouth, as well as Cambridge and Peterborough would also be heavily affected.Cities and towns around the Humber estuary, such as Hull, Scunthorpe and Grimsby would also experience intense flooding.